29
/
en
AIzaSyAYiBZKx7MnpbEhh9jyipgxe19OcubqV5w
April 1, 2024
37743
IDA & IBRD total
IBT
false
2
1
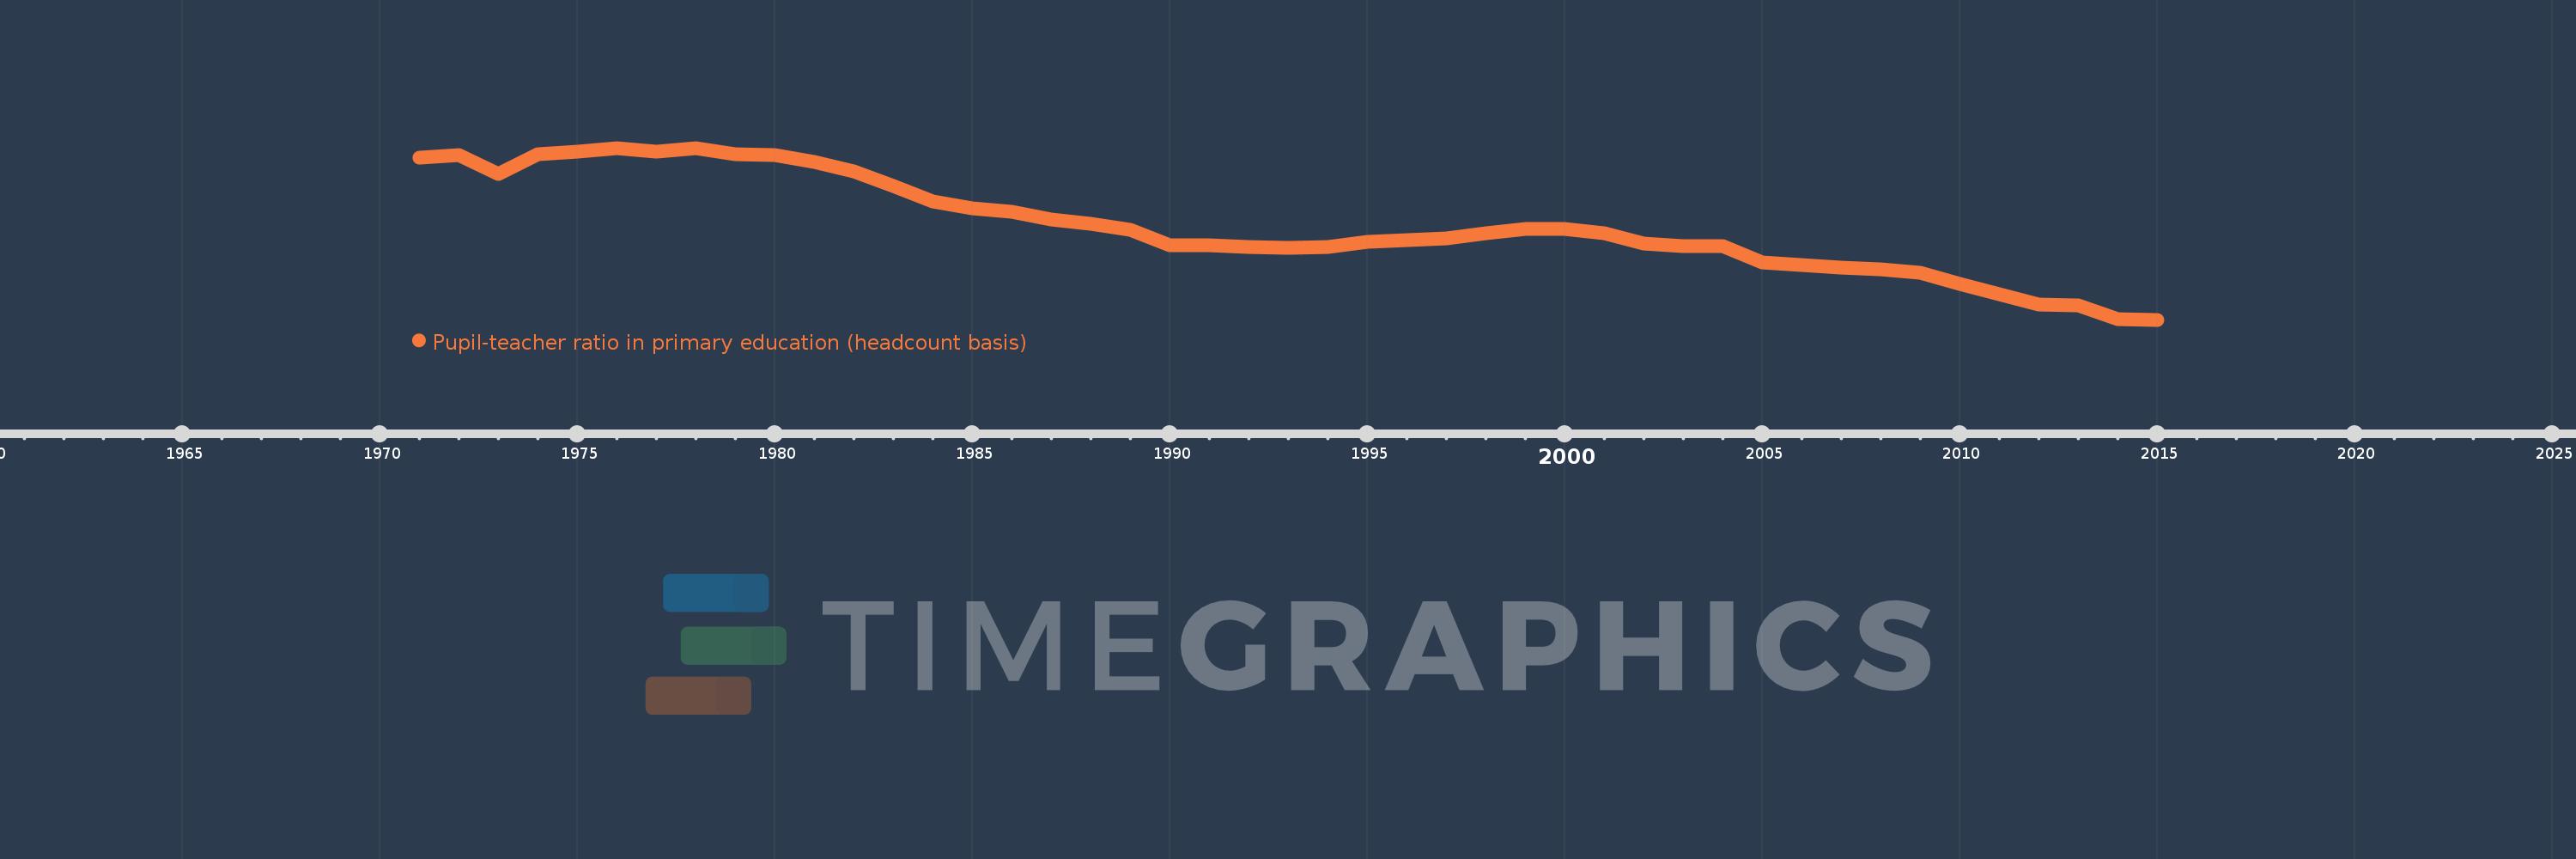
Pupil-teacher ratio in primary education (headcount basis)
2015,2014,2013,2012,2011,2010,2009,2008,2007,2006,2005,2004,2003,2002,2001,2000,1999,1998,1997,1996,1995,1994,1993,1992,1991,1990,1989,1988,1987,1986,1985,1984,1983,1982,1981,1980,1979,1978,1977,1976,1975,1974,1973,1972,1971
This statistics in other country:
AfghanistanAlbaniaAlgeriaAndorraAngolaAntigua and BarbudaArab WorldArgentinaArmeniaArubaAustraliaAustriaAzerbaijanBahamas, TheBahrainBangladeshBarbadosBelarusBelgiumBelizeBeninBermudaBhutanBoliviaBosnia and HerzegovinaBotswanaBrazilBritish Virgin IslandsBrunei DarussalamBulgariaBurkina FasoBurundiCabo VerdeCambodiaCameroonCanadaCaribbean small statesCayman IslandsCentral African RepublicCentral Europe and the BalticsChadChileChinaColombiaComorosCongo, Dem. Rep.Congo, Rep.Costa RicaCote d'IvoireCroatiaCubaCyprusCzech RepublicDenmarkDjiboutiDominicaDominican RepublicEarly-demographic dividendEast Asia & PacificEast Asia & Pacific (excluding high income)East Asia & Pacific (IDA & IBRD countries)EcuadorEgypt, Arab Rep.El SalvadorEquatorial GuineaEritreaEstoniaEthiopiaEuro areaEurope & Central AsiaEurope & Central Asia (excluding high income)Europe & Central Asia (IDA & IBRD countries)European UnionFijiFinlandFragile and conflict affected situationsFranceGabonGambia, TheGeorgiaGermanyGhanaGibraltarGreeceGrenadaGuatemalaGuineaGuinea-BissauGuyanaHaitiHeavily indebted poor countries (HIPC)High incomeHondurasHong Kong SAR, ChinaHungaryIBRD onlyIcelandIDA & IBRD totalIDA blendIDA onlyIDA totalIndiaIndonesiaIran, Islamic Rep.IraqIrelandIsraelItalyJamaicaJapanJordanKazakhstanKenyaKiribatiKorea, Dem. People’s Rep.Korea, Rep.KuwaitKyrgyz RepublicLao PDRLate-demographic dividendLatin America & Caribbean Latin America & Caribbean (excluding high income)Latin America & the Caribbean (IDA & IBRD countries)LatviaLeast developed countries: UN classificationLebanonLesothoLiberiaLibyaLiechtensteinLithuaniaLow & middle incomeLow incomeLower middle incomeLuxembourgMacao SAR, ChinaMacedonia, FYRMadagascarMalawiMalaysiaMaldivesMaliMaltaMarshall IslandsMauritaniaMauritiusMexicoMicronesia, Fed. Sts.Middle East & North AfricaMiddle East & North Africa (excluding high income)Middle East & North Africa (IDA & IBRD countries)Middle incomeMoldovaMonacoMongoliaMoroccoMozambiqueMyanmarNamibiaNauruNepalNetherlandsNew ZealandNicaraguaNigerNigeriaNorth AmericaNorwayOECD membersOmanOther small statesPacific island small statesPakistanPalauPanamaPapua New GuineaParaguayPeruPhilippinesPolandPortugalPost-demographic dividendPre-demographic dividendPuerto RicoQatarRomaniaRussian FederationRwandaSamoaSan MarinoSao Tome and PrincipeSaudi ArabiaSenegalSerbiaSeychellesSierra LeoneSingaporeSint Maarten (Dutch part)Slovak RepublicSloveniaSmall statesSolomon IslandsSomaliaSouth AfricaSouth AsiaSouth Asia (IDA & IBRD)South SudanSpainSri LankaSt. Kitts and NevisSt. LuciaSt. Vincent and the GrenadinesSub-Saharan Africa Sub-Saharan Africa (excluding high income)Sub-Saharan Africa (IDA & IBRD countries)SudanSurinameSwazilandSwedenSwitzerlandSyrian Arab RepublicTajikistanTanzaniaThailandTimor-LesteTogoTongaTrinidad and TobagoTunisiaTurkeyTurks and Caicos IslandsTuvaluUgandaUkraineUnited Arab EmiratesUnited KingdomUnited StatesUpper middle incomeUruguayUzbekistanVanuatuVenezuela, RBVietnamWest Bank and GazaWorldYemen, Rep.ZambiaZimbabwe Timeline:
This timeline shows a graph from 1971 to 2015 of IDA & IBRD total. No data until 1970. Number of actual observations by date: 45.
Source name:
World Development Indicators
Source organization:
UNESCO Institute for Statistics
Categories, topics:
Education
Last updated:
apr 23, 2017
Indicators value changes by year
Minimum:
25.728
jan 1, 2015
Maximum:
31.807
jan 1, 1978
At the date of observation
Value
Absolute change
Change from previous value
jan 1, 1971
31.453
+31.453
0.0%
jan 1, 1972
31.545
+0.091
0.29%
jan 1, 1973
30.894
-0.651
-2.06%
jan 1, 1974
31.571
+0.677
2.19%
jan 1, 1975
31.679
+0.108
0.34%
jan 1, 1976
31.804
+0.124
0.39%
jan 1, 1977
31.687
-0.116
-0.37%
jan 1, 1978
31.807
+0.12
0.38%
jan 1, 1979
31.589
-0.219
-0.69%
jan 1, 1980
31.569
-0.019
-0.06%
jan 1, 1981
31.301
-0.268
-0.85%
jan 1, 1982
30.971
-0.33
-1.05%
jan 1, 1983
30.458
-0.513
-1.66%
jan 1, 1984
29.917
-0.54
-1.77%
jan 1, 1985
29.656
-0.261
-0.87%
jan 1, 1986
29.551
-0.105
-0.35%
jan 1, 1987
29.261
-0.291
-0.98%
jan 1, 1988
29.126
-0.134
-0.46%
jan 1, 1989
28.918
-0.208
-0.71%
jan 1, 1990
28.372
-0.546
-1.89%
jan 1, 1991
28.358
-0.014
-0.05%
jan 1, 1992
28.317
-0.041
-0.15%
jan 1, 1993
28.287
-0.03
-0.11%
jan 1, 1994
28.3
+0.013
0.05%
jan 1, 1995
28.487
+0.186
0.66%
jan 1, 1996
28.546
+0.059
0.21%
jan 1, 1997
28.597
+0.051
0.18%
jan 1, 1998
28.801
+0.204
0.71%
jan 1, 1999
28.95
+0.149
0.52%
jan 1, 2000
28.945
-0.005
-0.02%
jan 1, 2001
28.775
-0.17
-0.59%
jan 1, 2002
28.426
-0.349
-1.21%
jan 1, 2003
28.327
-0.099
-0.35%
jan 1, 2004
28.341
+0.014
0.05%
jan 1, 2005
27.765
-0.577
-2.04%
jan 1, 2006
27.664
-0.101
-0.36%
jan 1, 2007
27.587
-0.077
-0.28%
jan 1, 2008
27.499
-0.088
-0.32%
jan 1, 2009
27.403
-0.096
-0.35%
jan 1, 2010
26.983
-0.42
-1.53%
jan 1, 2011
26.624
-0.359
-1.33%
jan 1, 2012
26.273
-0.351
-1.32%
jan 1, 2013
26.229
-0.044
-0.17%
jan 1, 2014
25.76
-0.469
-1.79%
jan 1, 2015
25.728
-0.032
-0.12%
Ranking of countries by current statistics by years


Comments: