29
/
en
AIzaSyAYiBZKx7MnpbEhh9jyipgxe19OcubqV5w
April 1, 2024
266286
Tonga
TON
true
2
1
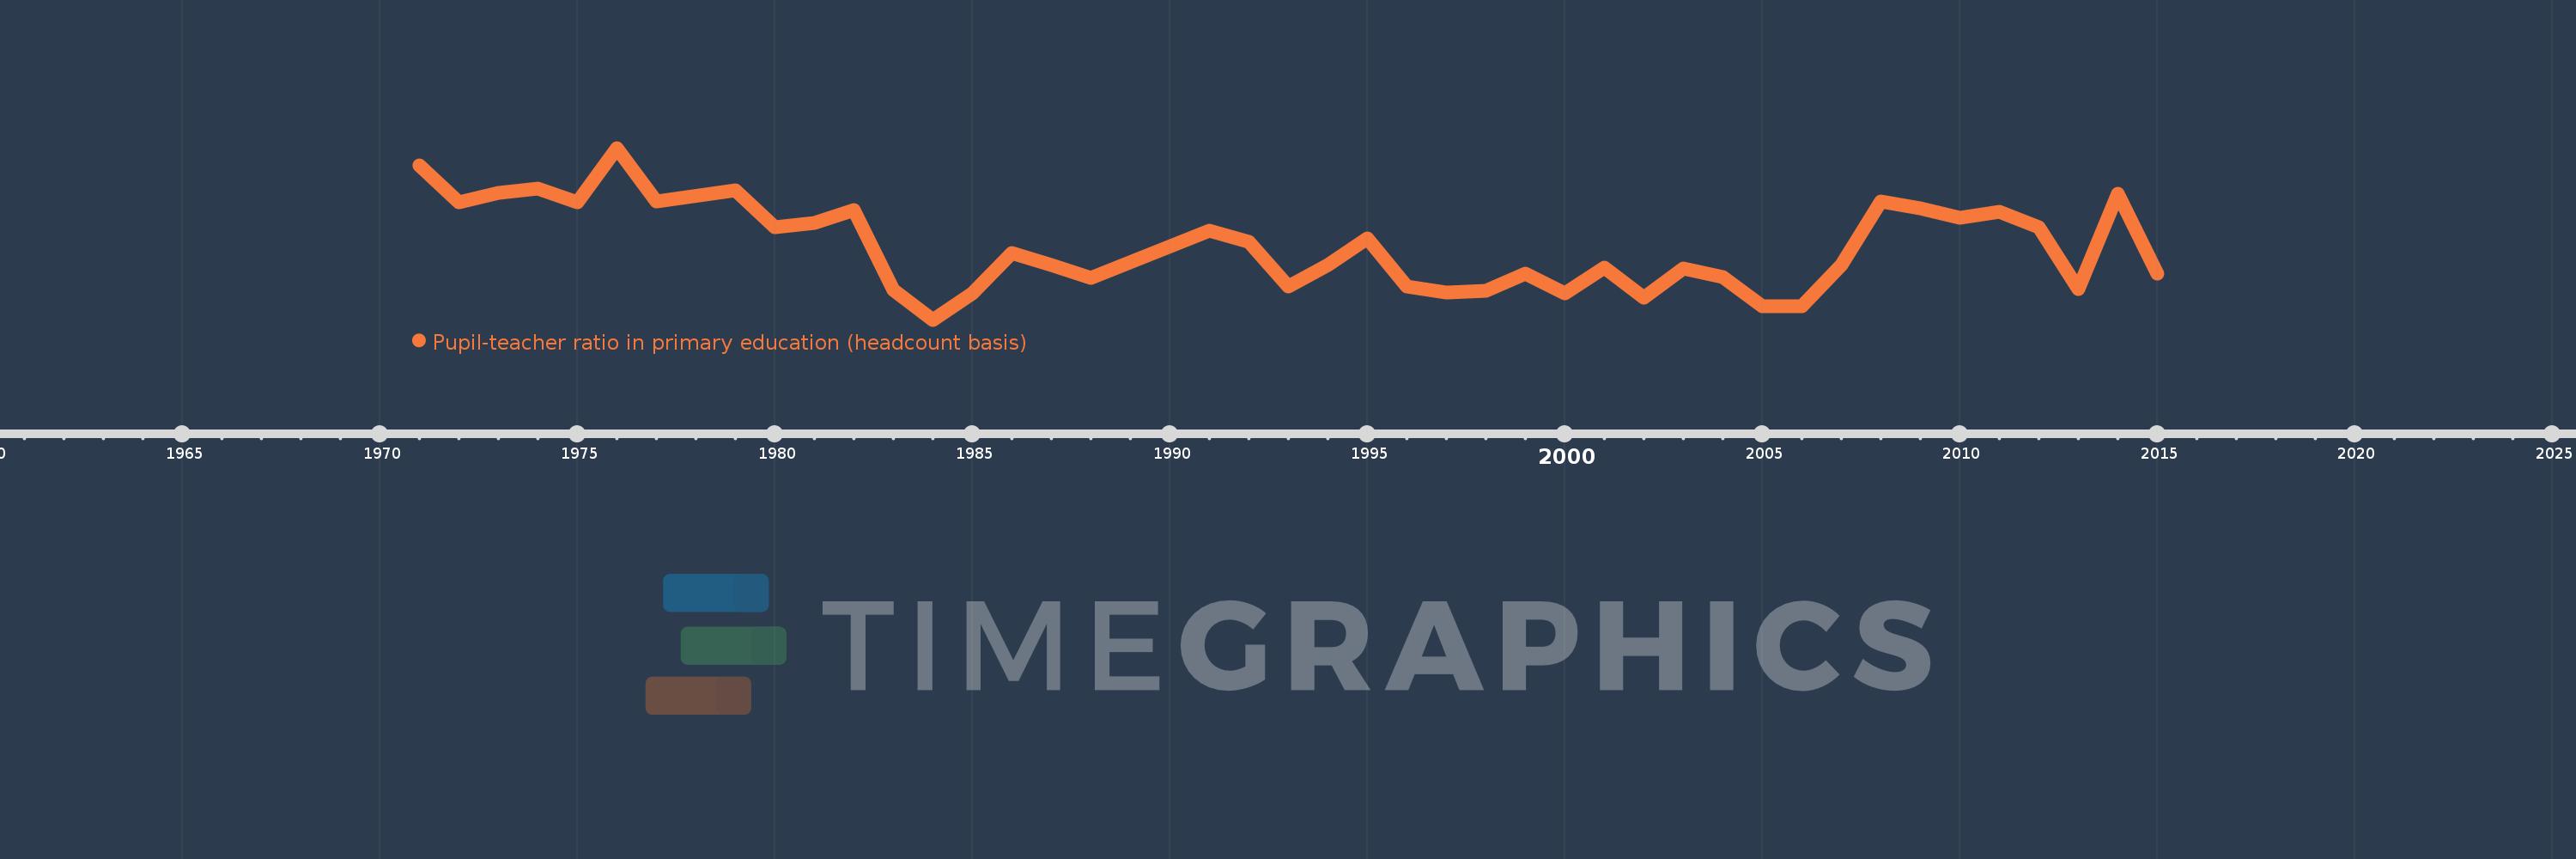
Pupil-teacher ratio in primary education (headcount basis)
2015,2014,2013,2012,2011,2010,2009,2008,2007,2006,2005,2004,2003,2002,2001,2000,1999,1998,1997,1996,1995,1994,1993,1992,1991,1988,1987,1986,1985,1984,1983,1982,1981,1980,1979,1977,1976,1975,1974,1973,1972,1971
This statistics in other country:
AfghanistanAlbaniaAlgeriaAndorraAngolaAntigua and BarbudaArab WorldArgentinaArmeniaArubaAustraliaAustriaAzerbaijanBahamas, TheBahrainBangladeshBarbadosBelarusBelgiumBelizeBeninBermudaBhutanBoliviaBosnia and HerzegovinaBotswanaBrazilBritish Virgin IslandsBrunei DarussalamBulgariaBurkina FasoBurundiCabo VerdeCambodiaCameroonCanadaCaribbean small statesCayman IslandsCentral African RepublicCentral Europe and the BalticsChadChileChinaColombiaComorosCongo, Dem. Rep.Congo, Rep.Costa RicaCote d'IvoireCroatiaCubaCyprusCzech RepublicDenmarkDjiboutiDominicaDominican RepublicEarly-demographic dividendEast Asia & PacificEast Asia & Pacific (excluding high income)East Asia & Pacific (IDA & IBRD countries)EcuadorEgypt, Arab Rep.El SalvadorEquatorial GuineaEritreaEstoniaEthiopiaEuro areaEurope & Central AsiaEurope & Central Asia (excluding high income)Europe & Central Asia (IDA & IBRD countries)European UnionFijiFinlandFragile and conflict affected situationsFranceGabonGambia, TheGeorgiaGermanyGhanaGibraltarGreeceGrenadaGuatemalaGuineaGuinea-BissauGuyanaHaitiHeavily indebted poor countries (HIPC)High incomeHondurasHong Kong SAR, ChinaHungaryIBRD onlyIcelandIDA & IBRD totalIDA blendIDA onlyIDA totalIndiaIndonesiaIran, Islamic Rep.IraqIrelandIsraelItalyJamaicaJapanJordanKazakhstanKenyaKiribatiKorea, Dem. People’s Rep.Korea, Rep.KuwaitKyrgyz RepublicLao PDRLate-demographic dividendLatin America & Caribbean Latin America & Caribbean (excluding high income)Latin America & the Caribbean (IDA & IBRD countries)LatviaLeast developed countries: UN classificationLebanonLesothoLiberiaLibyaLiechtensteinLithuaniaLow & middle incomeLow incomeLower middle incomeLuxembourgMacao SAR, ChinaMacedonia, FYRMadagascarMalawiMalaysiaMaldivesMaliMaltaMarshall IslandsMauritaniaMauritiusMexicoMicronesia, Fed. Sts.Middle East & North AfricaMiddle East & North Africa (excluding high income)Middle East & North Africa (IDA & IBRD countries)Middle incomeMoldovaMonacoMongoliaMoroccoMozambiqueMyanmarNamibiaNauruNepalNetherlandsNew ZealandNicaraguaNigerNigeriaNorth AmericaNorwayOECD membersOmanOther small statesPacific island small statesPakistanPalauPanamaPapua New GuineaParaguayPeruPhilippinesPolandPortugalPost-demographic dividendPre-demographic dividendPuerto RicoQatarRomaniaRussian FederationRwandaSamoaSan MarinoSao Tome and PrincipeSaudi ArabiaSenegalSerbiaSeychellesSierra LeoneSingaporeSint Maarten (Dutch part)Slovak RepublicSloveniaSmall statesSolomon IslandsSomaliaSouth AfricaSouth AsiaSouth Asia (IDA & IBRD)South SudanSpainSri LankaSt. Kitts and NevisSt. LuciaSt. Vincent and the GrenadinesSub-Saharan Africa Sub-Saharan Africa (excluding high income)Sub-Saharan Africa (IDA & IBRD countries)SudanSurinameSwazilandSwedenSwitzerlandSyrian Arab RepublicTajikistanTanzaniaThailandTimor-LesteTogoTongaTrinidad and TobagoTunisiaTurkeyTurks and Caicos IslandsTuvaluUgandaUkraineUnited Arab EmiratesUnited KingdomUnited StatesUpper middle incomeUruguayUzbekistanVanuatuVenezuela, RBVietnamWest Bank and GazaWorldYemen, Rep.ZambiaZimbabwe Timeline:
This timeline shows a graph from 1971 to 2015 of Tonga. No data until 1970. Number of actual observations by date: 42.
Source name:
World Development Indicators
Source organization:
UNESCO Institute for Statistics
Categories, topics:
Education
Last updated:
apr 23, 2017
Indicators value changes by year
Minimum:
19.626
jan 1, 1984
Maximum:
27.994
jan 1, 1976
At the date of observation
Value
Absolute change
Change from previous value
jan 1, 1971
27.15
+27.15
0.0%
jan 1, 1972
25.333
-1.817
-6.69%
jan 1, 1973
25.804
+0.47
1.86%
jan 1, 1974
26.034
+0.231
0.89%
jan 1, 1975
25.347
-0.687
-2.64%
jan 1, 1976
27.994
+2.647
10.44%
jan 1, 1977
25.39
-2.604
-9.3%
jan 1, 1979
25.926
+0.537
2.11%
jan 1, 1980
24.137
-1.789
-6.9%
jan 1, 1981
24.343
+0.206
0.85%
jan 1, 1982
24.984
+0.641
2.63%
jan 1, 1983
21.061
-3.924
-15.7%
jan 1, 1984
19.626
-1.434
-6.81%
jan 1, 1985
20.89
+1.264
6.44%
jan 1, 1986
22.875
+1.985
9.5%
jan 1, 1987
22.311
-0.564
-2.46%
jan 1, 1988
21.652
-0.66
-2.96%
jan 1, 1991
23.98
+2.328
10.75%
jan 1, 1992
23.429
-0.551
-2.3%
jan 1, 1993
21.247
-2.181
-9.31%
jan 1, 1994
22.271
+1.023
4.82%
jan 1, 1995
23.595
+1.324
5.95%
jan 1, 1996
21.24
-2.355
-9.98%
jan 1, 1997
20.966
-0.273
-1.29%
jan 1, 1998
21.02
+0.054
0.26%
jan 1, 1999
21.888
+0.868
4.13%
jan 1, 2000
20.9
-0.988
-4.51%
jan 1, 2001
22.145
+1.244
5.95%
jan 1, 2002
20.696
-1.448
-6.54%
jan 1, 2003
22.128
+1.432
6.92%
jan 1, 2004
21.712
-0.416
-1.88%
jan 1, 2005
20.3
-1.412
-6.5%
jan 1, 2006
20.3
+0.0
0.0%
jan 1, 2007
22.291
+1.99
9.8%
jan 1, 2008
25.402
+3.111
13.96%
jan 1, 2009
25.063
-0.338
-1.33%
jan 1, 2010
24.587
-0.476
-1.9%
jan 1, 2011
24.886
+0.299
1.22%
jan 1, 2012
24.126
-0.76
-3.05%
jan 1, 2013
21.105
-3.021
-12.52%
jan 1, 2014
25.748
+4.642
22.0%
jan 1, 2015
21.858
-3.89
-15.11%
Ranking of countries by current statistics by years


Comments: