29
/
en
AIzaSyAYiBZKx7MnpbEhh9jyipgxe19OcubqV5w
April 1, 2024
32138
Europe & Central Asia (excluding high income)
ECA
false
2
1
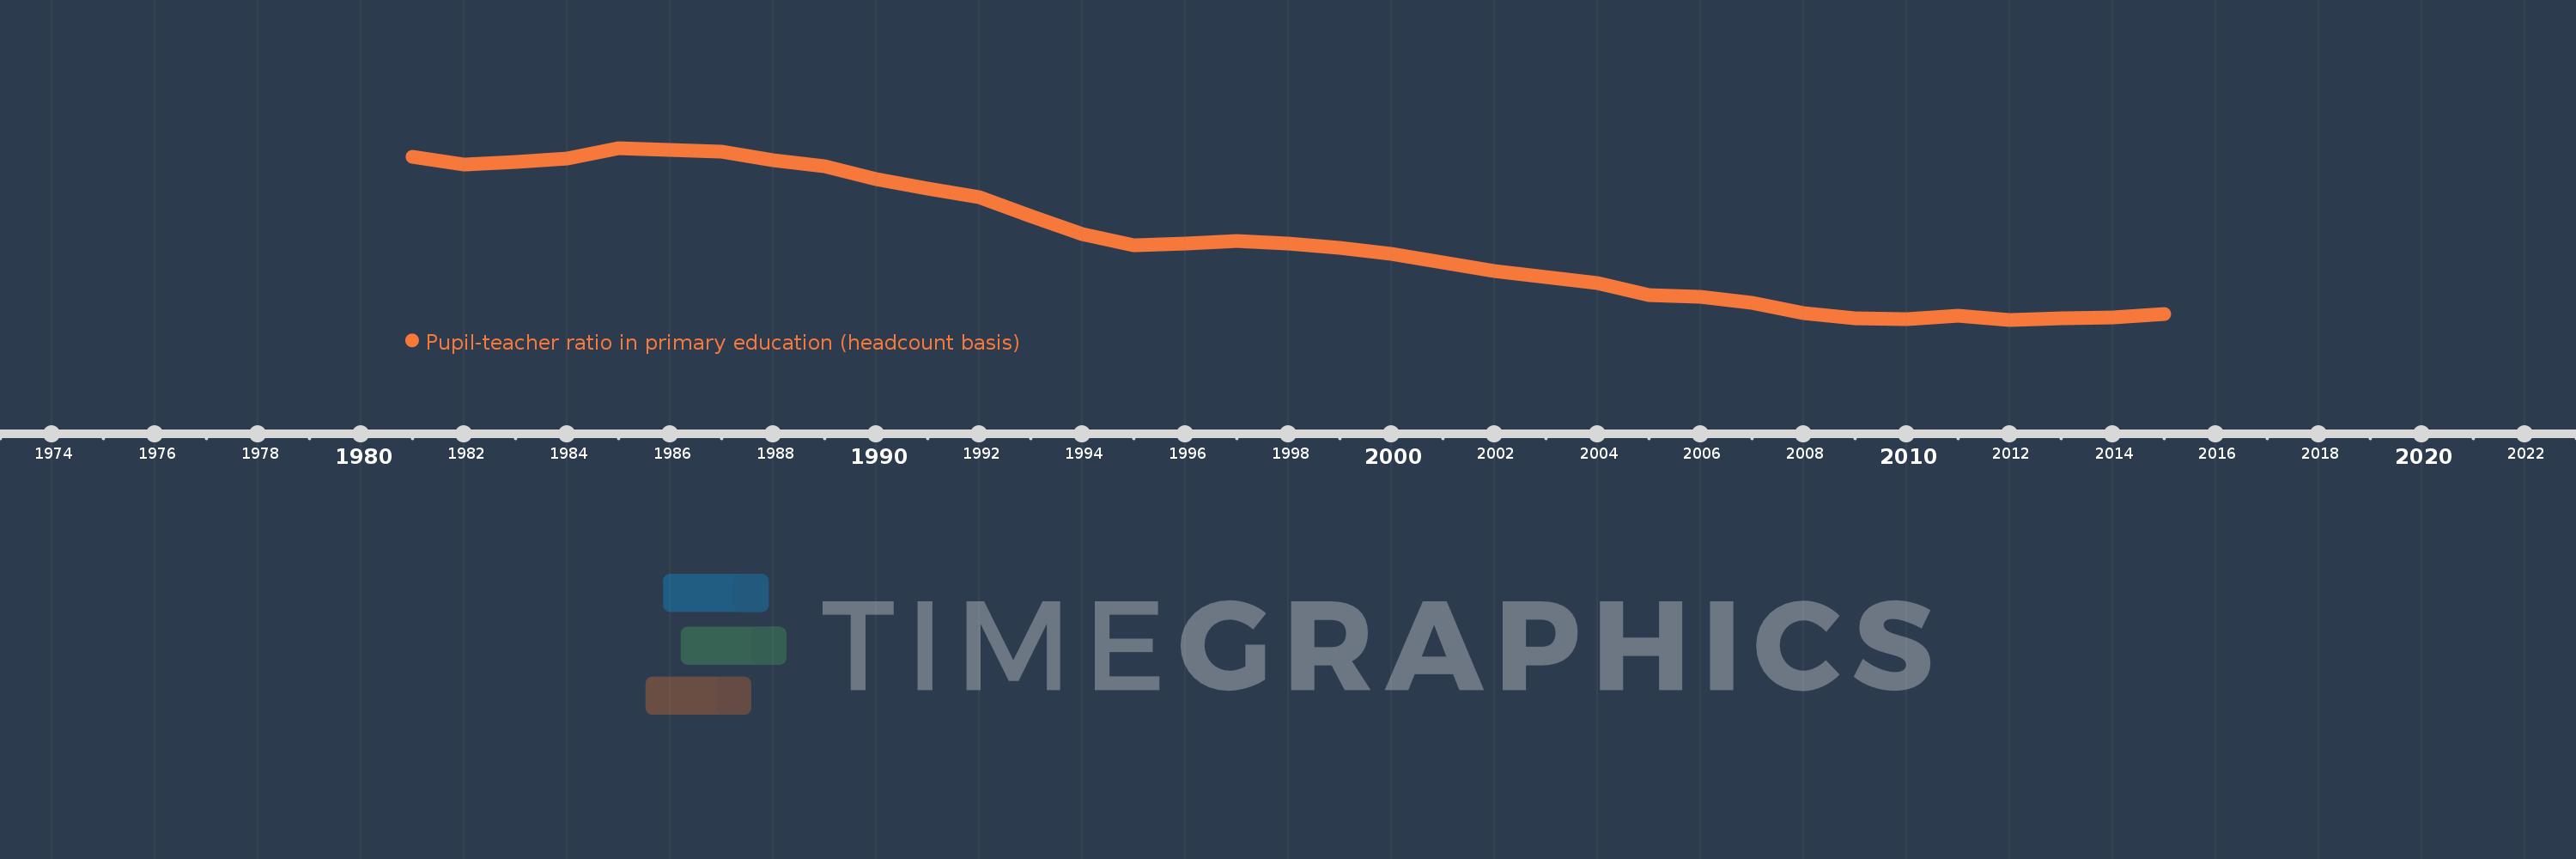
Pupil-teacher ratio in primary education (headcount basis)
2015,2014,2013,2012,2011,2010,2009,2008,2007,2006,2005,2004,2003,2002,2001,2000,1999,1998,1997,1996,1995,1994,1993,1992,1991,1990,1989,1988,1987,1986,1985,1984,1983,1982,1981
This statistics in other country:
AfghanistanAlbaniaAlgeriaAndorraAngolaAntigua and BarbudaArab WorldArgentinaArmeniaArubaAustraliaAustriaAzerbaijanBahamas, TheBahrainBangladeshBarbadosBelarusBelgiumBelizeBeninBermudaBhutanBoliviaBosnia and HerzegovinaBotswanaBrazilBritish Virgin IslandsBrunei DarussalamBulgariaBurkina FasoBurundiCabo VerdeCambodiaCameroonCanadaCaribbean small statesCayman IslandsCentral African RepublicCentral Europe and the BalticsChadChileChinaColombiaComorosCongo, Dem. Rep.Congo, Rep.Costa RicaCote d'IvoireCroatiaCubaCyprusCzech RepublicDenmarkDjiboutiDominicaDominican RepublicEarly-demographic dividendEast Asia & PacificEast Asia & Pacific (excluding high income)East Asia & Pacific (IDA & IBRD countries)EcuadorEgypt, Arab Rep.El SalvadorEquatorial GuineaEritreaEstoniaEthiopiaEuro areaEurope & Central AsiaEurope & Central Asia (excluding high income)Europe & Central Asia (IDA & IBRD countries)European UnionFijiFinlandFragile and conflict affected situationsFranceGabonGambia, TheGeorgiaGermanyGhanaGibraltarGreeceGrenadaGuatemalaGuineaGuinea-BissauGuyanaHaitiHeavily indebted poor countries (HIPC)High incomeHondurasHong Kong SAR, ChinaHungaryIBRD onlyIcelandIDA & IBRD totalIDA blendIDA onlyIDA totalIndiaIndonesiaIran, Islamic Rep.IraqIrelandIsraelItalyJamaicaJapanJordanKazakhstanKenyaKiribatiKorea, Dem. People’s Rep.Korea, Rep.KuwaitKyrgyz RepublicLao PDRLate-demographic dividendLatin America & Caribbean Latin America & Caribbean (excluding high income)Latin America & the Caribbean (IDA & IBRD countries)LatviaLeast developed countries: UN classificationLebanonLesothoLiberiaLibyaLiechtensteinLithuaniaLow & middle incomeLow incomeLower middle incomeLuxembourgMacao SAR, ChinaMacedonia, FYRMadagascarMalawiMalaysiaMaldivesMaliMaltaMarshall IslandsMauritaniaMauritiusMexicoMicronesia, Fed. Sts.Middle East & North AfricaMiddle East & North Africa (excluding high income)Middle East & North Africa (IDA & IBRD countries)Middle incomeMoldovaMonacoMongoliaMoroccoMozambiqueMyanmarNamibiaNauruNepalNetherlandsNew ZealandNicaraguaNigerNigeriaNorth AmericaNorwayOECD membersOmanOther small statesPacific island small statesPakistanPalauPanamaPapua New GuineaParaguayPeruPhilippinesPolandPortugalPost-demographic dividendPre-demographic dividendPuerto RicoQatarRomaniaRussian FederationRwandaSamoaSan MarinoSao Tome and PrincipeSaudi ArabiaSenegalSerbiaSeychellesSierra LeoneSingaporeSint Maarten (Dutch part)Slovak RepublicSloveniaSmall statesSolomon IslandsSomaliaSouth AfricaSouth AsiaSouth Asia (IDA & IBRD)South SudanSpainSri LankaSt. Kitts and NevisSt. LuciaSt. Vincent and the GrenadinesSub-Saharan Africa Sub-Saharan Africa (excluding high income)Sub-Saharan Africa (IDA & IBRD countries)SudanSurinameSwazilandSwedenSwitzerlandSyrian Arab RepublicTajikistanTanzaniaThailandTimor-LesteTogoTongaTrinidad and TobagoTunisiaTurkeyTurks and Caicos IslandsTuvaluUgandaUkraineUnited Arab EmiratesUnited KingdomUnited StatesUpper middle incomeUruguayUzbekistanVanuatuVenezuela, RBVietnamWest Bank and GazaWorldYemen, Rep.ZambiaZimbabwe Timeline:
This timeline shows a graph from 1981 to 2015 of Europe & Central Asia (excluding high income). No data until 1980. Number of actual observations by date: 35.
Source name:
World Development Indicators
Source organization:
UNESCO Institute for Statistics
Categories, topics:
Education
Last updated:
apr 23, 2017
Indicators value changes by year
Minimum:
18.018
jan 1, 2012
Maximum:
25.215
jan 1, 1985
At the date of observation
Value
Absolute change
Change from previous value
jan 1, 1981
24.831
+24.831
0.0%
jan 1, 1982
24.509
-0.322
-1.3%
jan 1, 1983
24.637
+0.128
0.52%
jan 1, 1984
24.771
+0.134
0.54%
jan 1, 1985
25.215
+0.444
1.79%
jan 1, 1986
25.122
-0.092
-0.37%
jan 1, 1987
25.045
-0.078
-0.31%
jan 1, 1988
24.702
-0.342
-1.37%
jan 1, 1989
24.447
-0.256
-1.04%
jan 1, 1990
23.898
-0.548
-2.24%
jan 1, 1991
23.5
-0.398
-1.67%
jan 1, 1992
23.165
-0.336
-1.43%
jan 1, 1993
22.346
-0.818
-3.53%
jan 1, 1994
21.597
-0.749
-3.35%
jan 1, 1995
21.148
-0.449
-2.08%
jan 1, 1996
21.222
+0.074
0.35%
jan 1, 1997
21.305
+0.084
0.39%
jan 1, 1998
21.196
-0.109
-0.51%
jan 1, 1999
21.012
-0.184
-0.87%
jan 1, 2000
20.781
-0.231
-1.1%
jan 1, 2001
20.413
-0.368
-1.77%
jan 1, 2002
20.071
-0.342
-1.68%
jan 1, 2003
19.819
-0.252
-1.25%
jan 1, 2004
19.541
-0.278
-1.4%
jan 1, 2005
19.059
-0.482
-2.47%
jan 1, 2006
18.988
-0.071
-0.37%
jan 1, 2007
18.714
-0.274
-1.44%
jan 1, 2008
18.295
-0.418
-2.23%
jan 1, 2009
18.073
-0.223
-1.22%
jan 1, 2010
18.055
-0.017
-0.1%
jan 1, 2011
18.205
+0.15
0.83%
jan 1, 2012
18.018
-0.187
-1.03%
jan 1, 2013
18.065
+0.046
0.26%
jan 1, 2014
18.123
+0.058
0.32%
jan 1, 2015
18.264
+0.141
0.78%
Ranking of countries by current statistics by years


Comments: