29
/
en
AIzaSyAYiBZKx7MnpbEhh9jyipgxe19OcubqV5w
April 1, 2024
83255
Belize
BLZ
true
2
1
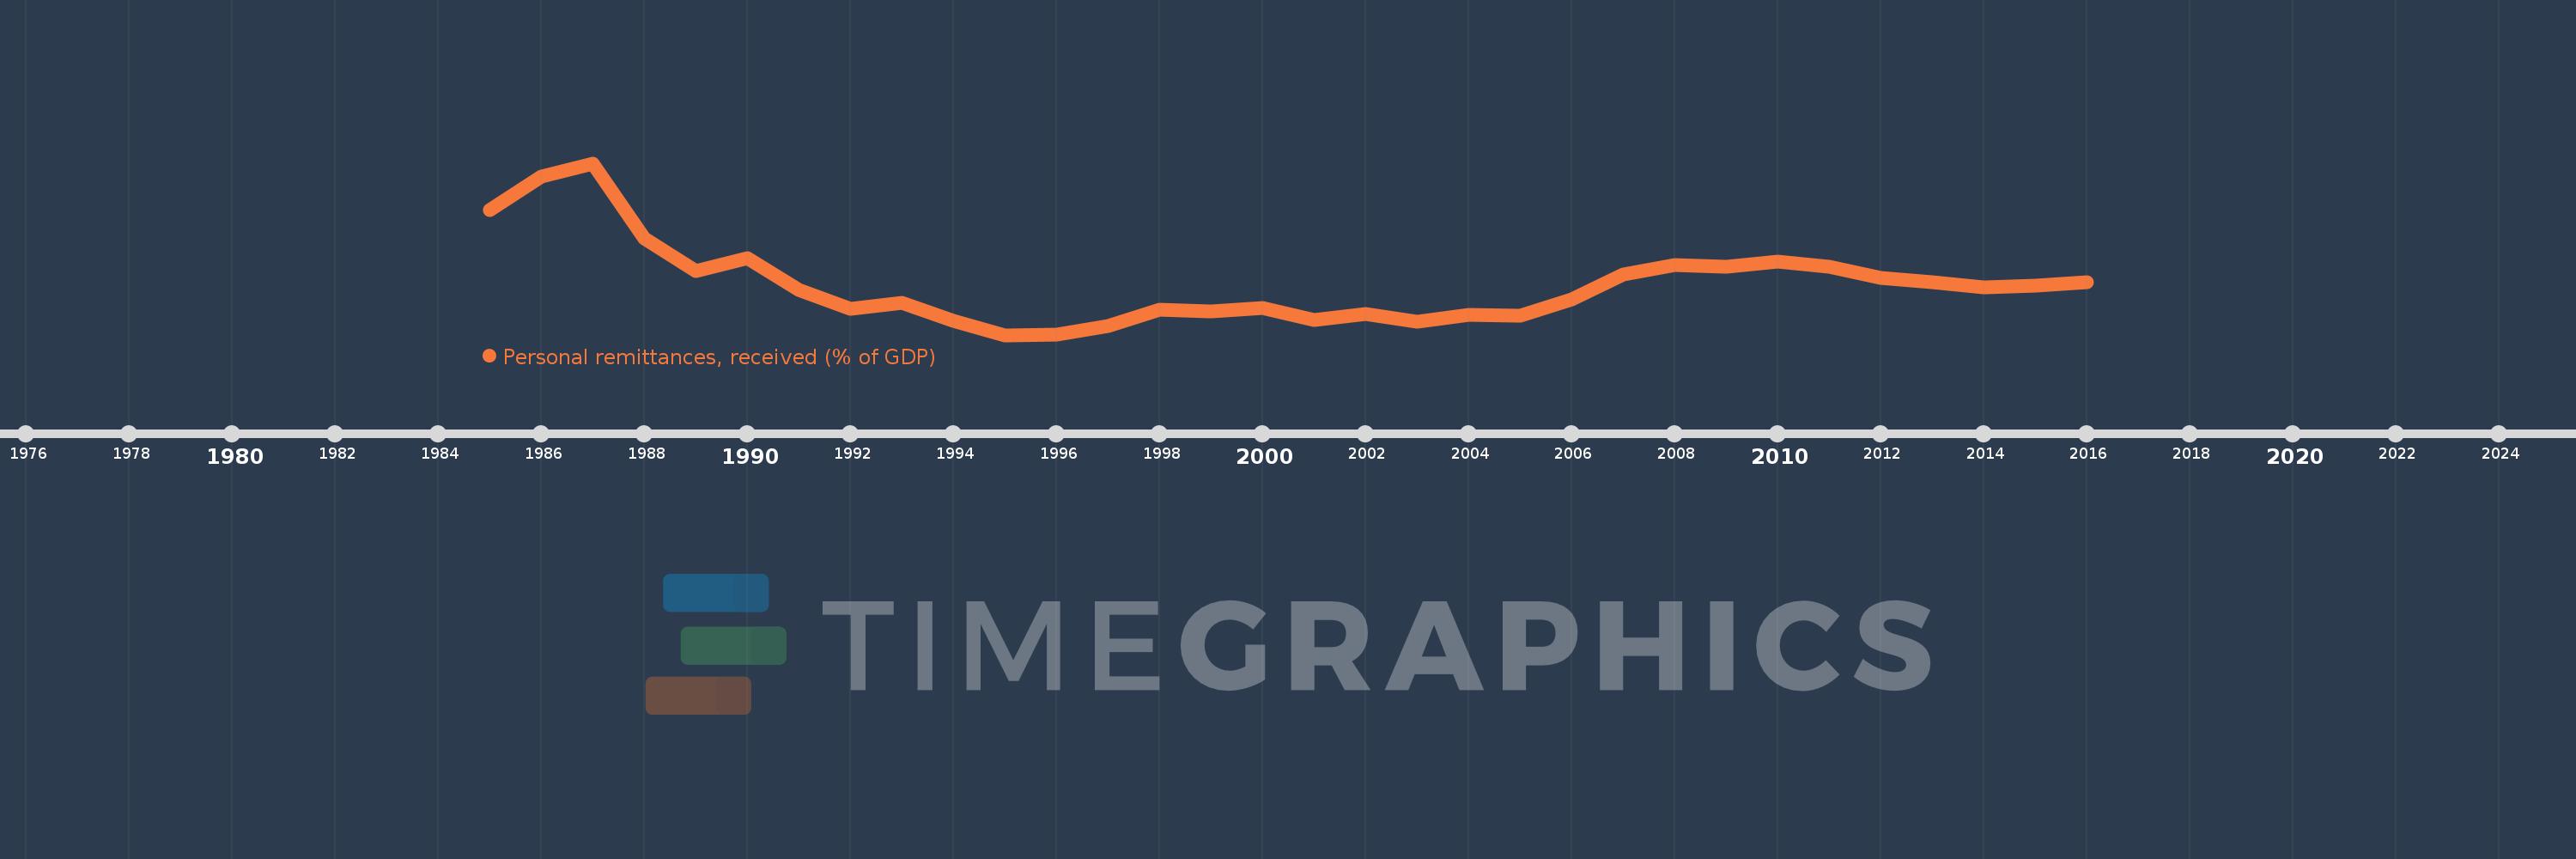
Personal remittances, received (% of GDP)
2016,2015,2014,2013,2012,2011,2010,2009,2008,2007,2006,2005,2004,2003,2002,2001,2000,1999,1998,1997,1996,1995,1994,1993,1992,1991,1990,1989,1988,1987,1986,1985
This statistics in other country:
AfghanistanAlbaniaAlgeriaAngolaAntigua and BarbudaArab WorldArgentinaArmeniaArubaAustraliaAustriaAzerbaijanBangladeshBarbadosBelarusBelgiumBelizeBeninBermudaBhutanBoliviaBosnia and HerzegovinaBotswanaBrazilBulgariaBurkina FasoBurundiCabo VerdeCambodiaCameroonCanadaCaribbean small statesCentral African RepublicCentral Europe and the BalticsChadChileChinaColombiaComorosCongo, Dem. Rep.Congo, Rep.Costa RicaCote d'IvoireCroatiaCyprusCzech RepublicDenmarkDjiboutiDominicaDominican RepublicEarly-demographic dividendEast Asia & PacificEast Asia & Pacific (excluding high income)East Asia & Pacific (IDA & IBRD countries)EcuadorEgypt, Arab Rep.El SalvadorEquatorial GuineaEritreaEstoniaEthiopiaEuro areaEurope & Central AsiaEurope & Central Asia (excluding high income)Europe & Central Asia (IDA & IBRD countries)European UnionFaroe IslandsFijiFinlandFragile and conflict affected situationsFranceGabonGambia, TheGeorgiaGermanyGhanaGreeceGrenadaGuatemalaGuineaGuinea-BissauGuyanaHaitiHeavily indebted poor countries (HIPC)High incomeHondurasHong Kong SAR, ChinaHungaryIBRD onlyIcelandIDA & IBRD totalIDA blendIDA onlyIDA totalIndiaIndonesiaIran, Islamic Rep.IraqIrelandIsraelItalyJamaicaJapanJordanKazakhstanKenyaKiribatiKorea, Rep.KosovoKuwaitKyrgyz RepublicLao PDRLate-demographic dividendLatin America & Caribbean Latin America & Caribbean (excluding high income)Latin America & the Caribbean (IDA & IBRD countries)LatviaLeast developed countries: UN classificationLebanonLesothoLiberiaLibyaLithuaniaLow & middle incomeLow incomeLower middle incomeLuxembourgMacao SAR, ChinaMacedonia, FYRMadagascarMalawiMalaysiaMaldivesMaliMaltaMarshall IslandsMauritaniaMauritiusMexicoMicronesia, Fed. Sts.Middle East & North AfricaMiddle East & North Africa (excluding high income)Middle East & North Africa (IDA & IBRD countries)Middle incomeMoldovaMongoliaMontenegroMoroccoMozambiqueMyanmarNamibiaNepalNetherlandsNew ZealandNicaraguaNigerNigeriaNorth AmericaNorwayOECD membersOmanOther small statesPacific island small statesPakistanPalauPanamaPapua New GuineaParaguayPeruPhilippinesPolandPortugalPost-demographic dividendPre-demographic dividendQatarRomaniaRussian FederationRwandaSamoaSao Tome and PrincipeSaudi ArabiaSenegalSerbiaSeychellesSierra LeoneSlovak RepublicSloveniaSmall statesSolomon IslandsSouth AfricaSouth AsiaSouth Asia (IDA & IBRD)South SudanSpainSri LankaSt. Kitts and NevisSt. LuciaSt. Vincent and the GrenadinesSub-Saharan Africa Sub-Saharan Africa (excluding high income)Sub-Saharan Africa (IDA & IBRD countries)SudanSurinameSwazilandSwedenSwitzerlandSyrian Arab RepublicTajikistanTanzaniaThailandTimor-LesteTogoTongaTrinidad and TobagoTunisiaTurkeyTurkmenistanTuvaluUgandaUkraineUnited KingdomUnited StatesUpper middle incomeUruguayUzbekistanVanuatuVenezuela, RBVietnamWest Bank and GazaWorldYemen, Rep.ZambiaZimbabwe Timeline:
This timeline shows a graph from 1985 to 2016 of Belize. No data until 1984. Number of actual observations by date: 32.
Source name:
World Development Indicators
Source organization:
World Bank staff estimates based on IMF balance of payments data, and World Bank and OECD GDP estimates.
Categories, topics:
Economy & Growth, Financial Sector
Last updated:
apr 23, 2017
Indicators value changes by year
Maximum:
10.709
jan 1, 1987
At the date of observation
Value
Absolute change
Change from previous value
jan 1, 1985
8.416
+8.416
0.0%
jan 1, 1986
10.065
+1.648
19.58%
jan 1, 1987
10.709
+0.644
6.4%
jan 1, 1988
6.997
-3.712
-34.66%
jan 1, 1989
5.383
-1.614
-23.07%
jan 1, 1990
6.044
+0.662
12.29%
jan 1, 1991
4.467
-1.578
-26.1%
jan 1, 1992
3.508
-0.959
-21.47%
jan 1, 1993
3.811
+0.303
8.64%
jan 1, 1994
2.947
-0.864
-22.67%
jan 1, 1995
2.233
-0.715
-24.25%
jan 1, 1996
2.241
+0.008
0.37%
jan 1, 1997
2.689
+0.449
20.02%
jan 1, 1998
3.469
+0.78
28.99%
jan 1, 1999
3.396
-0.073
-2.1%
jan 1, 2000
3.58
+0.183
5.4%
jan 1, 2001
2.989
-0.591
-16.51%
jan 1, 2002
3.257
+0.268
8.98%
jan 1, 2003
2.878
-0.379
-11.65%
jan 1, 2004
3.246
+0.369
12.81%
jan 1, 2005
3.181
-0.065
-2.01%
jan 1, 2006
4.011
+0.83
26.1%
jan 1, 2007
5.241
+1.23
30.67%
jan 1, 2008
5.666
+0.424
8.09%
jan 1, 2009
5.585
-0.081
-1.43%
jan 1, 2010
5.871
+0.286
5.12%
jan 1, 2011
5.588
-0.283
-4.82%
jan 1, 2012
5.059
-0.529
-9.46%
jan 1, 2013
4.825
-0.234
-4.62%
jan 1, 2014
4.576
-0.249
-5.16%
jan 1, 2015
4.676
+0.1
2.19%
jan 1, 2016
4.835
+0.158
3.38%
Ranking of countries by current statistics by years


Comments: