29
/
en
AIzaSyAYiBZKx7MnpbEhh9jyipgxe19OcubqV5w
April 1, 2024
189423
Maldives
MDV
true
2
1
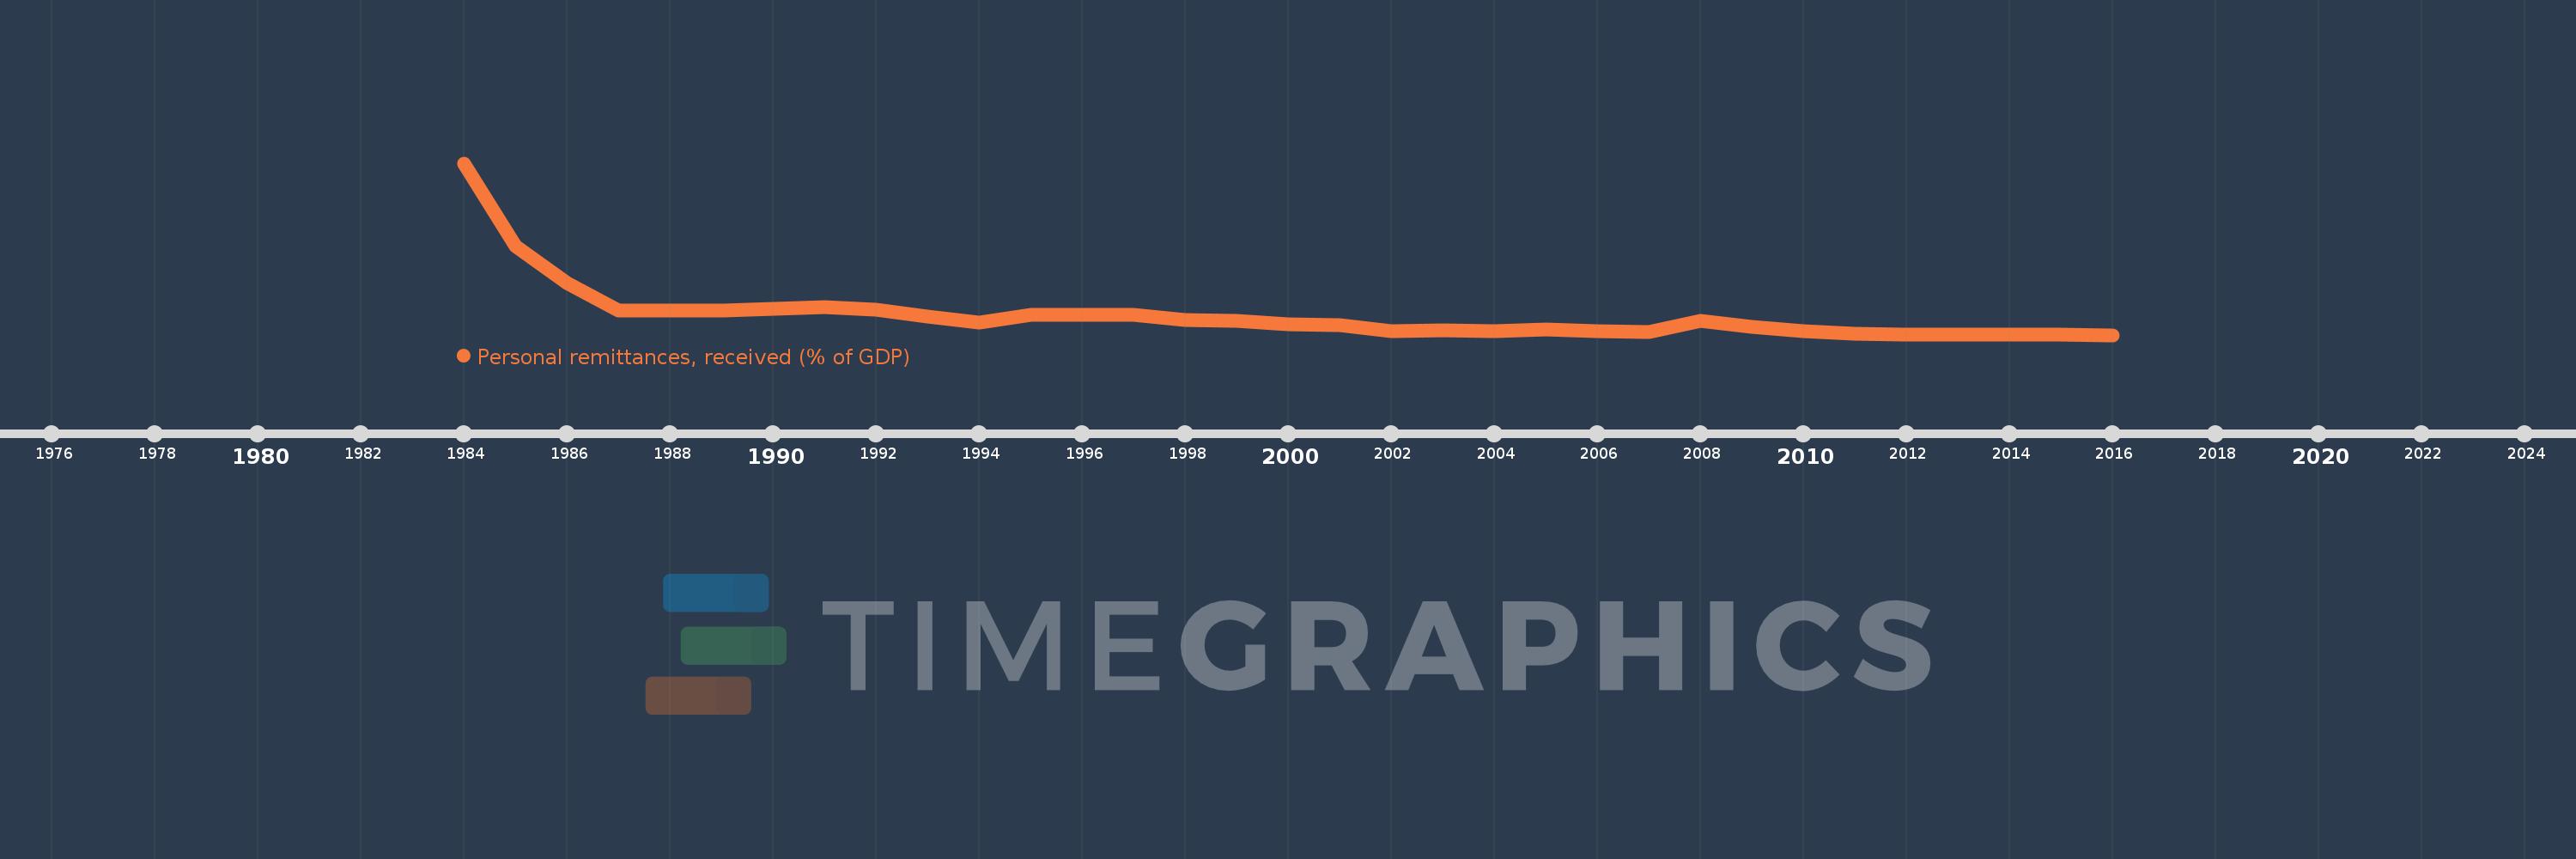
Personal remittances, received (% of GDP)
2016,2015,2014,2013,2012,2011,2010,2009,2008,2007,2006,2005,2004,2003,2002,2001,2000,1999,1998,1997,1996,1995,1994,1993,1992,1991,1990,1989,1988,1987,1986,1985,1984
This statistics in other country:
AfghanistanAlbaniaAlgeriaAngolaAntigua and BarbudaArab WorldArgentinaArmeniaArubaAustraliaAustriaAzerbaijanBangladeshBarbadosBelarusBelgiumBelizeBeninBermudaBhutanBoliviaBosnia and HerzegovinaBotswanaBrazilBulgariaBurkina FasoBurundiCabo VerdeCambodiaCameroonCanadaCaribbean small statesCentral African RepublicCentral Europe and the BalticsChadChileChinaColombiaComorosCongo, Dem. Rep.Congo, Rep.Costa RicaCote d'IvoireCroatiaCyprusCzech RepublicDenmarkDjiboutiDominicaDominican RepublicEarly-demographic dividendEast Asia & PacificEast Asia & Pacific (excluding high income)East Asia & Pacific (IDA & IBRD countries)EcuadorEgypt, Arab Rep.El SalvadorEquatorial GuineaEritreaEstoniaEthiopiaEuro areaEurope & Central AsiaEurope & Central Asia (excluding high income)Europe & Central Asia (IDA & IBRD countries)European UnionFaroe IslandsFijiFinlandFragile and conflict affected situationsFranceGabonGambia, TheGeorgiaGermanyGhanaGreeceGrenadaGuatemalaGuineaGuinea-BissauGuyanaHaitiHeavily indebted poor countries (HIPC)High incomeHondurasHong Kong SAR, ChinaHungaryIBRD onlyIcelandIDA & IBRD totalIDA blendIDA onlyIDA totalIndiaIndonesiaIran, Islamic Rep.IraqIrelandIsraelItalyJamaicaJapanJordanKazakhstanKenyaKiribatiKorea, Rep.KosovoKuwaitKyrgyz RepublicLao PDRLate-demographic dividendLatin America & Caribbean Latin America & Caribbean (excluding high income)Latin America & the Caribbean (IDA & IBRD countries)LatviaLeast developed countries: UN classificationLebanonLesothoLiberiaLibyaLithuaniaLow & middle incomeLow incomeLower middle incomeLuxembourgMacao SAR, ChinaMacedonia, FYRMadagascarMalawiMalaysiaMaldivesMaliMaltaMarshall IslandsMauritaniaMauritiusMexicoMicronesia, Fed. Sts.Middle East & North AfricaMiddle East & North Africa (excluding high income)Middle East & North Africa (IDA & IBRD countries)Middle incomeMoldovaMongoliaMontenegroMoroccoMozambiqueMyanmarNamibiaNepalNetherlandsNew ZealandNicaraguaNigerNigeriaNorth AmericaNorwayOECD membersOmanOther small statesPacific island small statesPakistanPalauPanamaPapua New GuineaParaguayPeruPhilippinesPolandPortugalPost-demographic dividendPre-demographic dividendQatarRomaniaRussian FederationRwandaSamoaSao Tome and PrincipeSaudi ArabiaSenegalSerbiaSeychellesSierra LeoneSlovak RepublicSloveniaSmall statesSolomon IslandsSouth AfricaSouth AsiaSouth Asia (IDA & IBRD)South SudanSpainSri LankaSt. Kitts and NevisSt. LuciaSt. Vincent and the GrenadinesSub-Saharan Africa Sub-Saharan Africa (excluding high income)Sub-Saharan Africa (IDA & IBRD countries)SudanSurinameSwazilandSwedenSwitzerlandSyrian Arab RepublicTajikistanTanzaniaThailandTimor-LesteTogoTongaTrinidad and TobagoTunisiaTurkeyTurkmenistanTuvaluUgandaUkraineUnited KingdomUnited StatesUpper middle incomeUruguayUzbekistanVanuatuVenezuela, RBVietnamWest Bank and GazaWorldYemen, Rep.ZambiaZimbabwe Timeline:
This timeline shows a graph from 1984 to 2016 of Maldives. No data until 1983. Number of actual observations by date: 33.
Source name:
World Development Indicators
Source organization:
World Bank staff estimates based on IMF balance of payments data, and World Bank and OECD GDP estimates.
Categories, topics:
Economy & Growth, Financial Sector
Last updated:
apr 23, 2017
Indicators value changes by year
At the date of observation
Value
Absolute change
Change from previous value
jan 1, 1984
4.323
+4.323
0.0%
jan 1, 1985
2.283
-2.04
-47.19%
jan 1, 1986
1.376
-0.907
-39.72%
jan 1, 1987
0.705
-0.672
-48.8%
jan 1, 1988
0.708
+0.003
0.45%
jan 1, 1989
0.712
+0.004
0.54%
jan 1, 1990
0.739
+0.027
3.79%
jan 1, 1991
0.79
+0.052
7.0%
jan 1, 1992
0.736
-0.054
-6.84%
jan 1, 1993
0.562
-0.175
-23.71%
jan 1, 1994
0.403
-0.158
-28.2%
jan 1, 1995
0.611
+0.207
51.43%
jan 1, 1996
0.593
-0.018
-2.92%
jan 1, 1997
0.601
+0.008
1.39%
jan 1, 1998
0.482
-0.119
-19.75%
jan 1, 1999
0.454
-0.029
-5.98%
jan 1, 2000
0.373
-0.081
-17.81%
jan 1, 2001
0.352
-0.021
-5.62%
jan 1, 2002
0.206
-0.146
-41.41%
jan 1, 2003
0.221
+0.015
7.15%
jan 1, 2004
0.193
-0.028
-12.7%
jan 1, 2005
0.241
+0.048
25.08%
jan 1, 2006
0.202
-0.04
-16.44%
jan 1, 2007
0.19
-0.012
-5.81%
jan 1, 2008
0.454
+0.265
139.33%
jan 1, 2009
0.297
-0.157
-34.65%
jan 1, 2010
0.21
-0.087
-29.33%
jan 1, 2011
0.136
-0.074
-35.21%
jan 1, 2012
0.122
-0.014
-10.0%
jan 1, 2013
0.125
+0.003
2.13%
jan 1, 2014
0.118
-0.007
-5.4%
jan 1, 2015
0.112
-0.006
-5.15%
jan 1, 2016
0.106
-0.006
-5.42%
Ranking of countries by current statistics by years


Comments: