29
/
en
AIzaSyAYiBZKx7MnpbEhh9jyipgxe19OcubqV5w
April 1, 2024
41807
Latin America & Caribbean
LCN
false
2
1
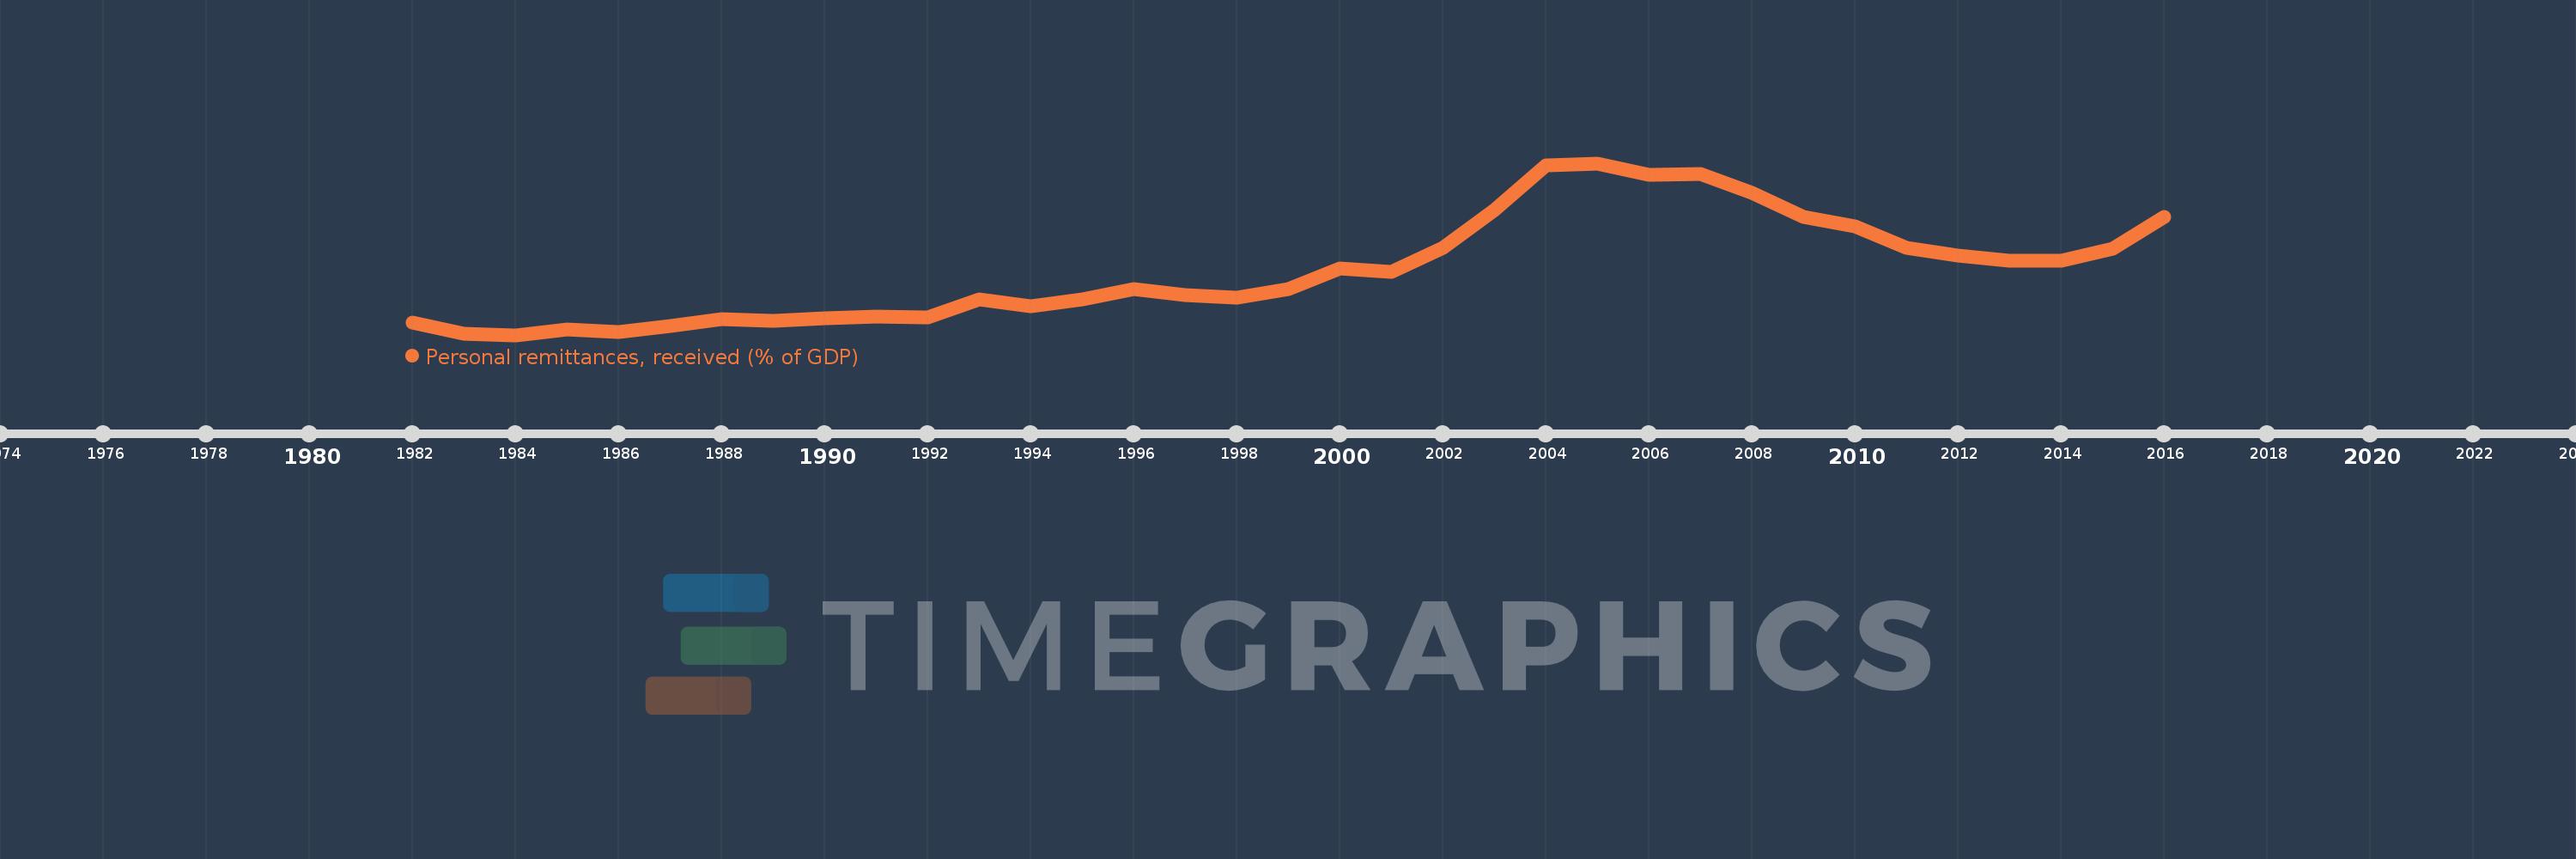
Personal remittances, received (% of GDP)
2016,2015,2014,2013,2012,2011,2010,2009,2008,2007,2006,2005,2004,2003,2002,2001,2000,1999,1998,1997,1996,1995,1994,1993,1992,1991,1990,1989,1988,1987,1986,1985,1984,1983,1982
This statistics in other country:
AfghanistanAlbaniaAlgeriaAngolaAntigua and BarbudaArab WorldArgentinaArmeniaArubaAustraliaAustriaAzerbaijanBangladeshBarbadosBelarusBelgiumBelizeBeninBermudaBhutanBoliviaBosnia and HerzegovinaBotswanaBrazilBulgariaBurkina FasoBurundiCabo VerdeCambodiaCameroonCanadaCaribbean small statesCentral African RepublicCentral Europe and the BalticsChadChileChinaColombiaComorosCongo, Dem. Rep.Congo, Rep.Costa RicaCote d'IvoireCroatiaCyprusCzech RepublicDenmarkDjiboutiDominicaDominican RepublicEarly-demographic dividendEast Asia & PacificEast Asia & Pacific (excluding high income)East Asia & Pacific (IDA & IBRD countries)EcuadorEgypt, Arab Rep.El SalvadorEquatorial GuineaEritreaEstoniaEthiopiaEuro areaEurope & Central AsiaEurope & Central Asia (excluding high income)Europe & Central Asia (IDA & IBRD countries)European UnionFaroe IslandsFijiFinlandFragile and conflict affected situationsFranceGabonGambia, TheGeorgiaGermanyGhanaGreeceGrenadaGuatemalaGuineaGuinea-BissauGuyanaHaitiHeavily indebted poor countries (HIPC)High incomeHondurasHong Kong SAR, ChinaHungaryIBRD onlyIcelandIDA & IBRD totalIDA blendIDA onlyIDA totalIndiaIndonesiaIran, Islamic Rep.IraqIrelandIsraelItalyJamaicaJapanJordanKazakhstanKenyaKiribatiKorea, Rep.KosovoKuwaitKyrgyz RepublicLao PDRLate-demographic dividendLatin America & Caribbean Latin America & Caribbean (excluding high income)Latin America & the Caribbean (IDA & IBRD countries)LatviaLeast developed countries: UN classificationLebanonLesothoLiberiaLibyaLithuaniaLow & middle incomeLow incomeLower middle incomeLuxembourgMacao SAR, ChinaMacedonia, FYRMadagascarMalawiMalaysiaMaldivesMaliMaltaMarshall IslandsMauritaniaMauritiusMexicoMicronesia, Fed. Sts.Middle East & North AfricaMiddle East & North Africa (excluding high income)Middle East & North Africa (IDA & IBRD countries)Middle incomeMoldovaMongoliaMontenegroMoroccoMozambiqueMyanmarNamibiaNepalNetherlandsNew ZealandNicaraguaNigerNigeriaNorth AmericaNorwayOECD membersOmanOther small statesPacific island small statesPakistanPalauPanamaPapua New GuineaParaguayPeruPhilippinesPolandPortugalPost-demographic dividendPre-demographic dividendQatarRomaniaRussian FederationRwandaSamoaSao Tome and PrincipeSaudi ArabiaSenegalSerbiaSeychellesSierra LeoneSlovak RepublicSloveniaSmall statesSolomon IslandsSouth AfricaSouth AsiaSouth Asia (IDA & IBRD)South SudanSpainSri LankaSt. Kitts and NevisSt. LuciaSt. Vincent and the GrenadinesSub-Saharan Africa Sub-Saharan Africa (excluding high income)Sub-Saharan Africa (IDA & IBRD countries)SudanSurinameSwazilandSwedenSwitzerlandSyrian Arab RepublicTajikistanTanzaniaThailandTimor-LesteTogoTongaTrinidad and TobagoTunisiaTurkeyTurkmenistanTuvaluUgandaUkraineUnited KingdomUnited StatesUpper middle incomeUruguayUzbekistanVanuatuVenezuela, RBVietnamWest Bank and GazaWorldYemen, Rep.ZambiaZimbabwe Timeline:
This timeline shows a graph from 1982 to 2016 of Latin America & Caribbean . No data until 1981. Number of actual observations by date: 35.
Source name:
World Development Indicators
Source organization:
World Bank staff estimates based on IMF balance of payments data, and World Bank and OECD GDP estimates.
Categories, topics:
Economy & Growth, Financial Sector
Last updated:
apr 23, 2017
Indicators value changes by year
At the date of observation
Value
Absolute change
Change from previous value
jan 1, 1982
0.472
+0.472
0.0%
jan 1, 1983
0.368
-0.103
-21.93%
jan 1, 1984
0.355
-0.013
-3.49%
jan 1, 1985
0.406
+0.051
14.24%
jan 1, 1986
0.386
-0.02
-5.03%
jan 1, 1987
0.439
+0.053
13.72%
jan 1, 1988
0.502
+0.064
14.53%
jan 1, 1989
0.481
-0.021
-4.25%
jan 1, 1990
0.507
+0.026
5.48%
jan 1, 1991
0.527
+0.02
3.95%
jan 1, 1992
0.513
-0.014
-2.74%
jan 1, 1993
0.68
+0.167
32.48%
jan 1, 1994
0.614
-0.065
-9.6%
jan 1, 1995
0.681
+0.066
10.81%
jan 1, 1996
0.773
+0.092
13.51%
jan 1, 1997
0.723
-0.05
-6.42%
jan 1, 1998
0.698
-0.025
-3.46%
jan 1, 1999
0.776
+0.078
11.22%
jan 1, 2000
0.966
+0.19
24.47%
jan 1, 2001
0.93
-0.036
-3.73%
jan 1, 2002
1.153
+0.223
23.96%
jan 1, 2003
1.493
+0.34
29.51%
jan 1, 2004
1.902
+0.409
27.39%
jan 1, 2005
1.922
+0.02
1.04%
jan 1, 2006
1.815
-0.107
-5.55%
jan 1, 2007
1.822
+0.007
0.37%
jan 1, 2008
1.65
-0.173
-9.47%
jan 1, 2009
1.436
-0.214
-12.98%
jan 1, 2010
1.345
-0.09
-6.29%
jan 1, 2011
1.153
-0.192
-14.28%
jan 1, 2012
1.076
-0.077
-6.71%
jan 1, 2013
1.032
-0.044
-4.07%
jan 1, 2014
1.029
-0.003
-0.27%
jan 1, 2015
1.142
+0.113
10.95%
jan 1, 2016
1.432
+0.29
25.36%
Ranking of countries by current statistics by years


Comments: