29
/
en
AIzaSyAYiBZKx7MnpbEhh9jyipgxe19OcubqV5w
April 1, 2024
191800
Malta
MLT
true
2
1
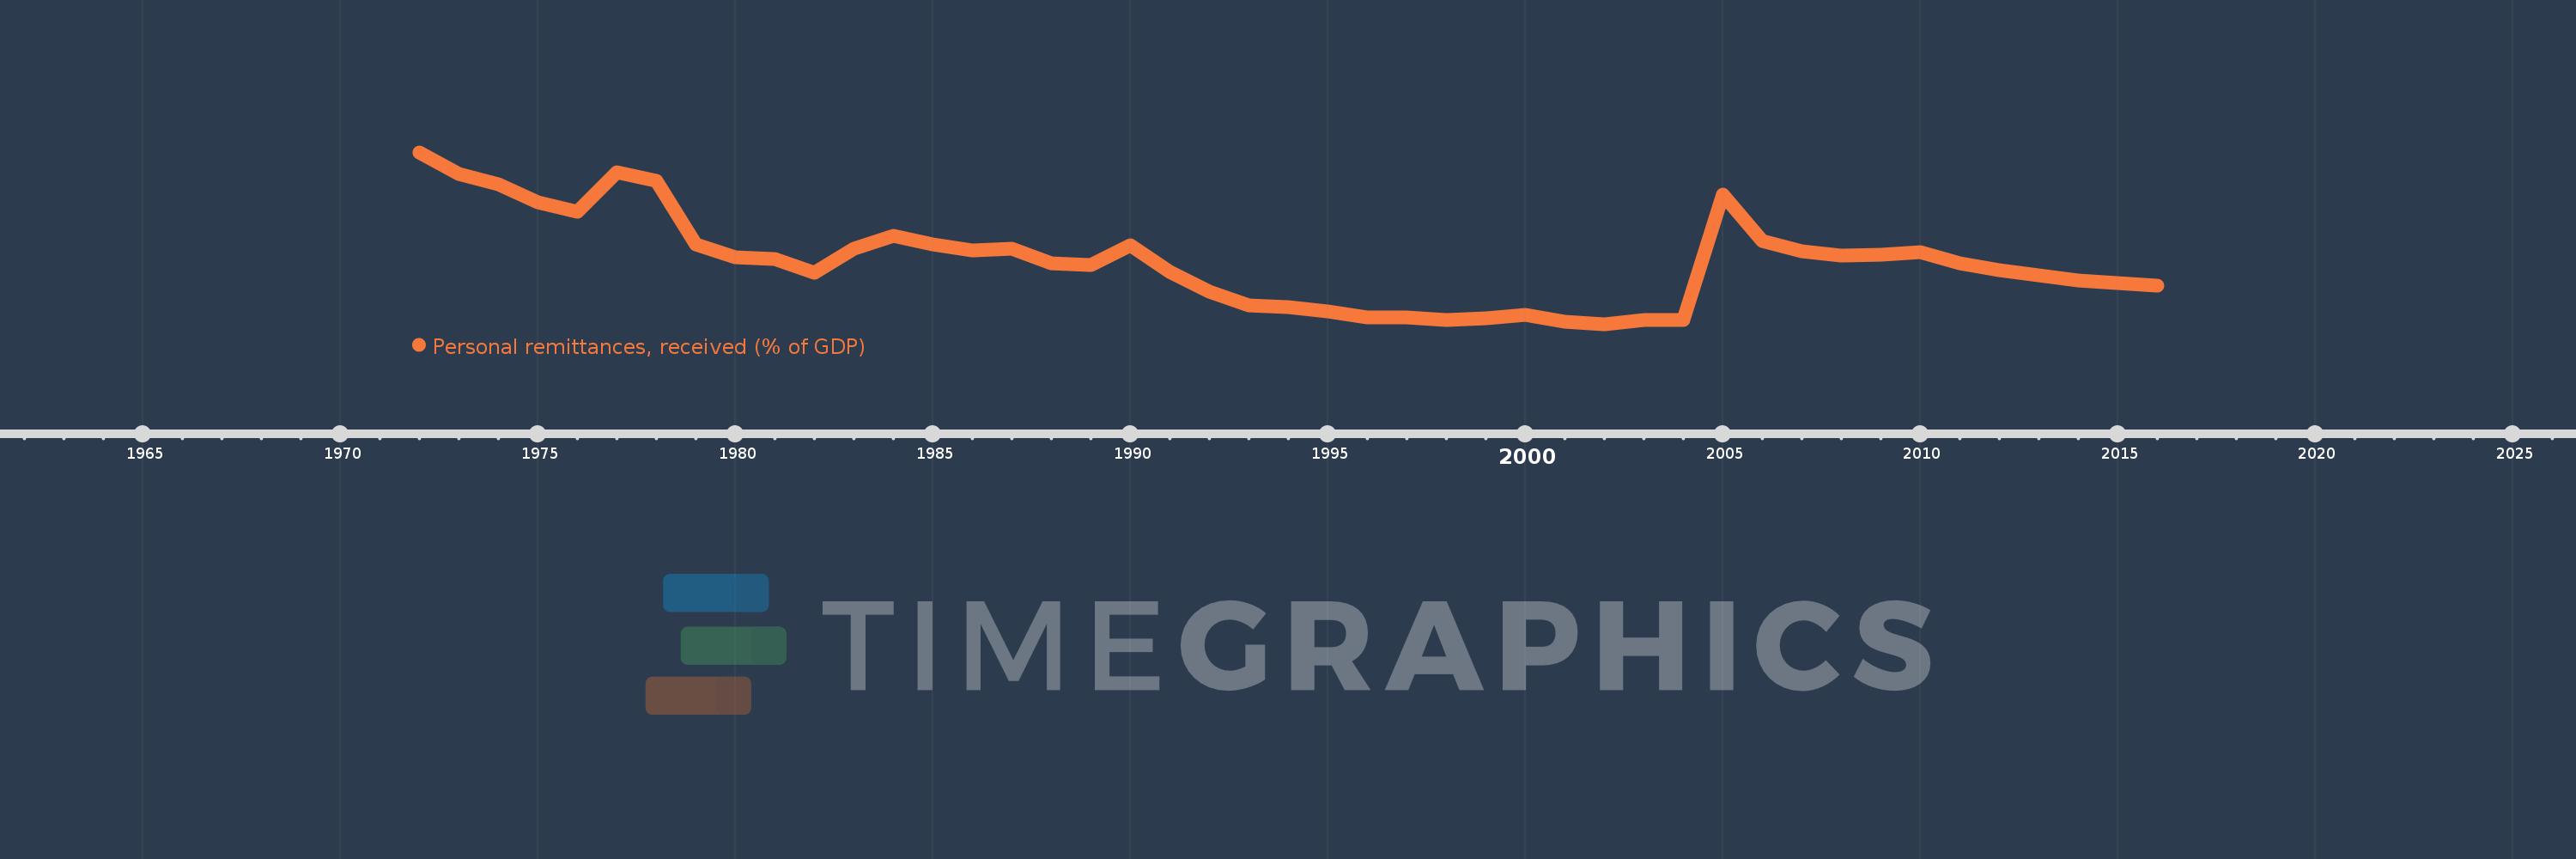
Personal remittances, received (% of GDP)
2016,2015,2014,2013,2012,2011,2010,2009,2008,2007,2006,2005,2004,2003,2002,2001,2000,1999,1998,1997,1996,1995,1994,1993,1992,1991,1990,1989,1988,1987,1986,1985,1984,1983,1982,1981,1980,1979,1978,1977,1976,1975,1974,1973,1972
This statistics in other country:
AfghanistanAlbaniaAlgeriaAngolaAntigua and BarbudaArab WorldArgentinaArmeniaArubaAustraliaAustriaAzerbaijanBangladeshBarbadosBelarusBelgiumBelizeBeninBermudaBhutanBoliviaBosnia and HerzegovinaBotswanaBrazilBulgariaBurkina FasoBurundiCabo VerdeCambodiaCameroonCanadaCaribbean small statesCentral African RepublicCentral Europe and the BalticsChadChileChinaColombiaComorosCongo, Dem. Rep.Congo, Rep.Costa RicaCote d'IvoireCroatiaCyprusCzech RepublicDenmarkDjiboutiDominicaDominican RepublicEarly-demographic dividendEast Asia & PacificEast Asia & Pacific (excluding high income)East Asia & Pacific (IDA & IBRD countries)EcuadorEgypt, Arab Rep.El SalvadorEquatorial GuineaEritreaEstoniaEthiopiaEuro areaEurope & Central AsiaEurope & Central Asia (excluding high income)Europe & Central Asia (IDA & IBRD countries)European UnionFaroe IslandsFijiFinlandFragile and conflict affected situationsFranceGabonGambia, TheGeorgiaGermanyGhanaGreeceGrenadaGuatemalaGuineaGuinea-BissauGuyanaHaitiHeavily indebted poor countries (HIPC)High incomeHondurasHong Kong SAR, ChinaHungaryIBRD onlyIcelandIDA & IBRD totalIDA blendIDA onlyIDA totalIndiaIndonesiaIran, Islamic Rep.IraqIrelandIsraelItalyJamaicaJapanJordanKazakhstanKenyaKiribatiKorea, Rep.KosovoKuwaitKyrgyz RepublicLao PDRLate-demographic dividendLatin America & Caribbean Latin America & Caribbean (excluding high income)Latin America & the Caribbean (IDA & IBRD countries)LatviaLeast developed countries: UN classificationLebanonLesothoLiberiaLibyaLithuaniaLow & middle incomeLow incomeLower middle incomeLuxembourgMacao SAR, ChinaMacedonia, FYRMadagascarMalawiMalaysiaMaldivesMaliMaltaMarshall IslandsMauritaniaMauritiusMexicoMicronesia, Fed. Sts.Middle East & North AfricaMiddle East & North Africa (excluding high income)Middle East & North Africa (IDA & IBRD countries)Middle incomeMoldovaMongoliaMontenegroMoroccoMozambiqueMyanmarNamibiaNepalNetherlandsNew ZealandNicaraguaNigerNigeriaNorth AmericaNorwayOECD membersOmanOther small statesPacific island small statesPakistanPalauPanamaPapua New GuineaParaguayPeruPhilippinesPolandPortugalPost-demographic dividendPre-demographic dividendQatarRomaniaRussian FederationRwandaSamoaSao Tome and PrincipeSaudi ArabiaSenegalSerbiaSeychellesSierra LeoneSlovak RepublicSloveniaSmall statesSolomon IslandsSouth AfricaSouth AsiaSouth Asia (IDA & IBRD)South SudanSpainSri LankaSt. Kitts and NevisSt. LuciaSt. Vincent and the GrenadinesSub-Saharan Africa Sub-Saharan Africa (excluding high income)Sub-Saharan Africa (IDA & IBRD countries)SudanSurinameSwazilandSwedenSwitzerlandSyrian Arab RepublicTajikistanTanzaniaThailandTimor-LesteTogoTongaTrinidad and TobagoTunisiaTurkeyTurkmenistanTuvaluUgandaUkraineUnited KingdomUnited StatesUpper middle incomeUruguayUzbekistanVanuatuVenezuela, RBVietnamWest Bank and GazaWorldYemen, Rep.ZambiaZimbabwe Timeline:
This timeline shows a graph from 1972 to 2016 of Malta. No data until 1971. Number of actual observations by date: 45.
Source name:
World Development Indicators
Source organization:
World Bank staff estimates based on IMF balance of payments data, and World Bank and OECD GDP estimates.
Categories, topics:
Economy & Growth, Financial Sector
Last updated:
apr 23, 2017
Indicators value changes by year
At the date of observation
Value
Absolute change
Change from previous value
jan 1, 1972
6.87
+6.87
0.0%
jan 1, 1973
6.039
-0.832
-12.1%
jan 1, 1974
5.649
-0.39
-6.45%
jan 1, 1975
4.966
-0.683
-12.08%
jan 1, 1976
4.6
-0.367
-7.38%
jan 1, 1977
6.104
+1.504
32.71%
jan 1, 1978
5.791
-0.313
-5.12%
jan 1, 1979
3.335
-2.457
-42.42%
jan 1, 1980
2.87
-0.465
-13.95%
jan 1, 1981
2.802
-0.068
-2.36%
jan 1, 1982
2.267
-0.535
-19.09%
jan 1, 1983
3.184
+0.917
40.46%
jan 1, 1984
3.67
+0.486
15.25%
jan 1, 1985
3.347
-0.323
-8.8%
jan 1, 1986
3.108
-0.238
-7.13%
jan 1, 1987
3.192
+0.084
2.69%
jan 1, 1988
2.628
-0.564
-17.66%
jan 1, 1989
2.559
-0.069
-2.61%
jan 1, 1990
3.305
+0.746
29.13%
jan 1, 1991
2.285
-1.02
-30.85%
jan 1, 1992
1.528
-0.757
-33.14%
jan 1, 1993
1.009
-0.519
-33.96%
jan 1, 1994
0.94
-0.069
-6.88%
jan 1, 1995
0.785
-0.154
-16.42%
jan 1, 1996
0.557
-0.229
-29.11%
jan 1, 1997
0.558
+0.001
0.24%
jan 1, 1998
0.446
-0.112
-19.98%
jan 1, 1999
0.527
+0.081
18.07%
jan 1, 2000
0.658
+0.131
24.86%
jan 1, 2001
0.406
-0.252
-38.27%
jan 1, 2002
0.298
-0.108
-26.54%
jan 1, 2003
0.452
+0.154
51.46%
jan 1, 2004
0.473
+0.021
4.57%
jan 1, 2005
5.256
+4.784
1.01K%
jan 1, 2006
3.475
-1.781
-33.89%
jan 1, 2007
3.089
-0.386
-11.11%
jan 1, 2008
2.91
-0.179
-5.79%
jan 1, 2009
2.946
+0.036
1.24%
jan 1, 2010
3.045
+0.099
3.36%
jan 1, 2011
2.627
-0.418
-13.73%
jan 1, 2012
2.375
-0.252
-9.59%
jan 1, 2013
2.161
-0.214
-9.0%
jan 1, 2014
1.98
-0.181
-8.4%
jan 1, 2015
1.879
-0.101
-5.1%
jan 1, 2016
1.757
-0.122
-6.49%
Ranking of countries by current statistics by years


Comments: