29
/
en
AIzaSyAYiBZKx7MnpbEhh9jyipgxe19OcubqV5w
April 1, 2024
82120
Belgium
BEL
true
2
1
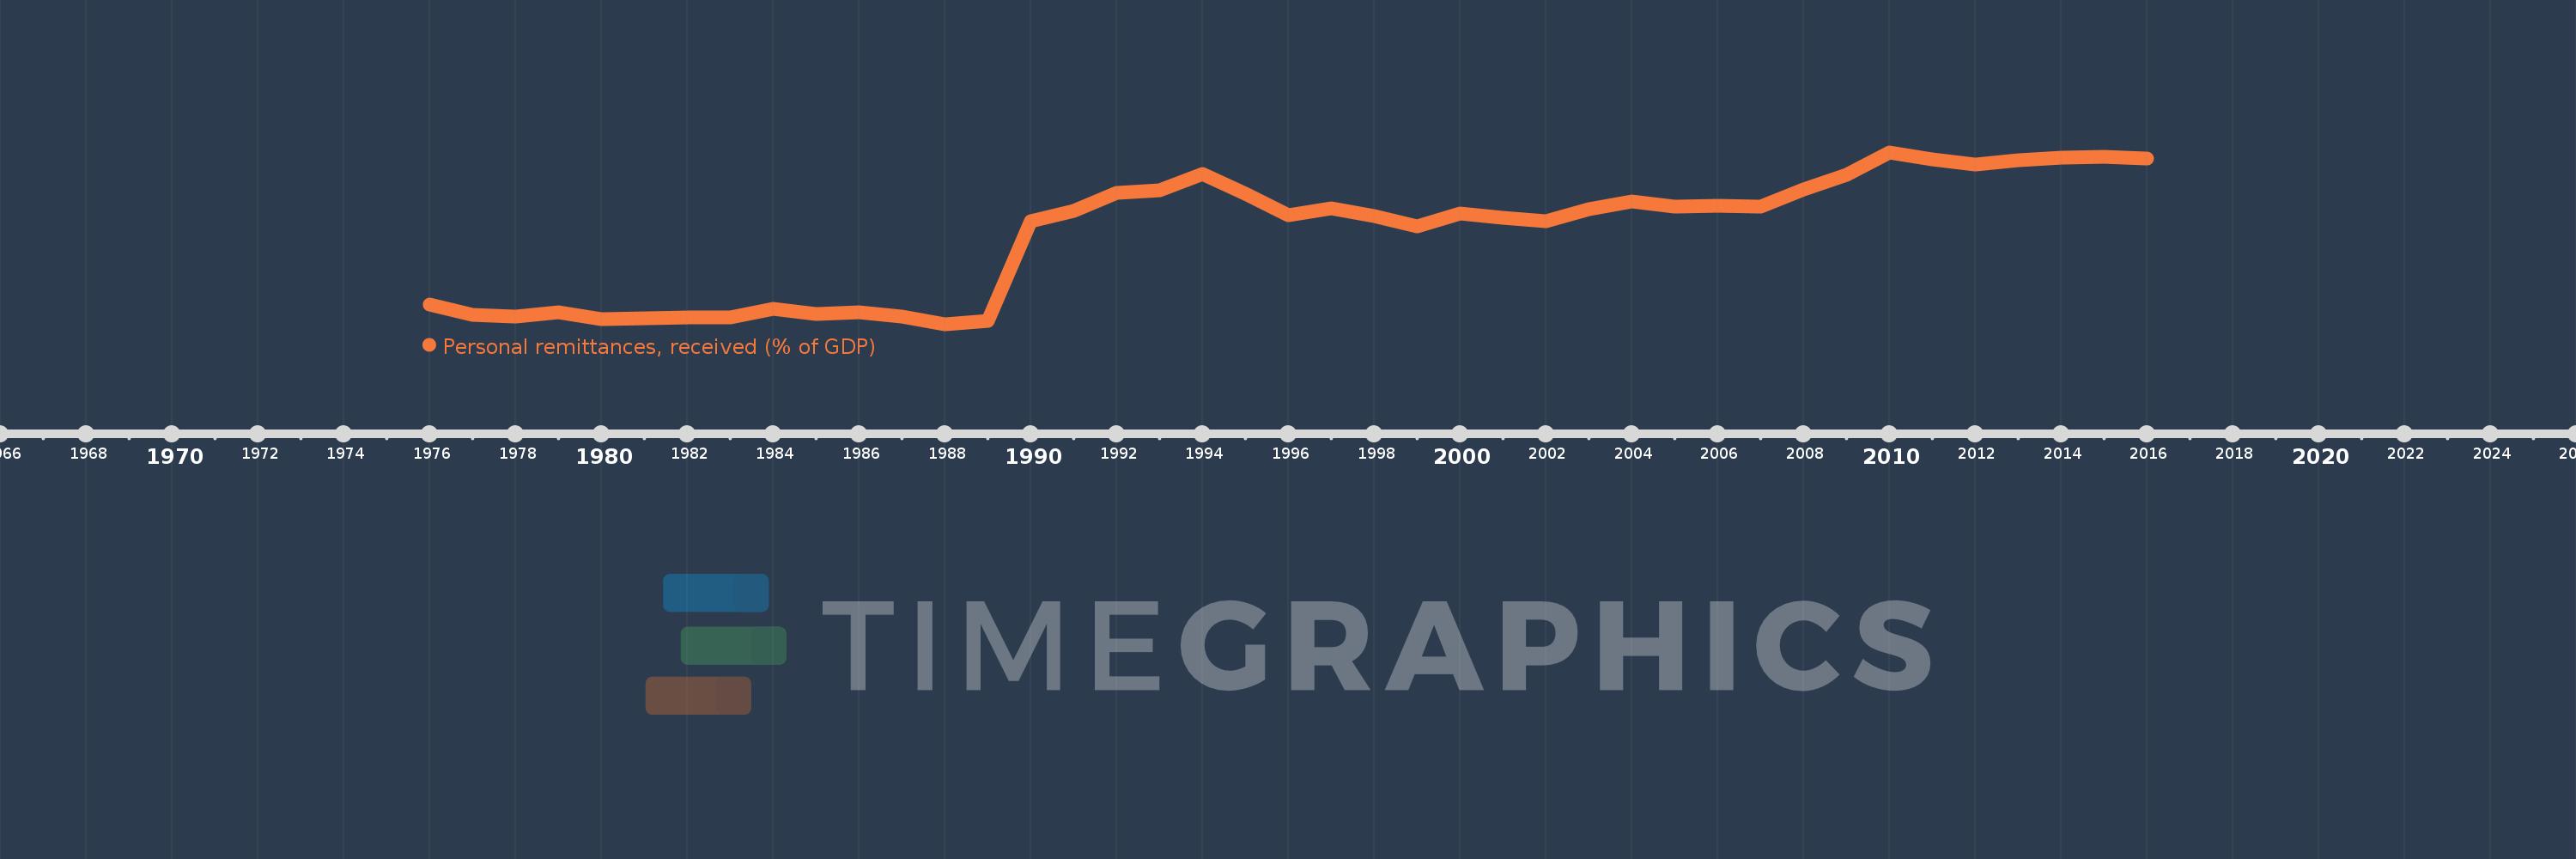
Personal remittances, received (% of GDP)
2016,2015,2014,2013,2012,2011,2010,2009,2008,2007,2006,2005,2004,2003,2002,2001,2000,1999,1998,1997,1996,1995,1994,1993,1992,1991,1990,1989,1988,1987,1986,1985,1984,1983,1982,1981,1980,1979,1978,1977,1976
This statistics in other country:
AfghanistanAlbaniaAlgeriaAngolaAntigua and BarbudaArab WorldArgentinaArmeniaArubaAustraliaAustriaAzerbaijanBangladeshBarbadosBelarusBelgiumBelizeBeninBermudaBhutanBoliviaBosnia and HerzegovinaBotswanaBrazilBulgariaBurkina FasoBurundiCabo VerdeCambodiaCameroonCanadaCaribbean small statesCentral African RepublicCentral Europe and the BalticsChadChileChinaColombiaComorosCongo, Dem. Rep.Congo, Rep.Costa RicaCote d'IvoireCroatiaCyprusCzech RepublicDenmarkDjiboutiDominicaDominican RepublicEarly-demographic dividendEast Asia & PacificEast Asia & Pacific (excluding high income)East Asia & Pacific (IDA & IBRD countries)EcuadorEgypt, Arab Rep.El SalvadorEquatorial GuineaEritreaEstoniaEthiopiaEuro areaEurope & Central AsiaEurope & Central Asia (excluding high income)Europe & Central Asia (IDA & IBRD countries)European UnionFaroe IslandsFijiFinlandFragile and conflict affected situationsFranceGabonGambia, TheGeorgiaGermanyGhanaGreeceGrenadaGuatemalaGuineaGuinea-BissauGuyanaHaitiHeavily indebted poor countries (HIPC)High incomeHondurasHong Kong SAR, ChinaHungaryIBRD onlyIcelandIDA & IBRD totalIDA blendIDA onlyIDA totalIndiaIndonesiaIran, Islamic Rep.IraqIrelandIsraelItalyJamaicaJapanJordanKazakhstanKenyaKiribatiKorea, Rep.KosovoKuwaitKyrgyz RepublicLao PDRLate-demographic dividendLatin America & Caribbean Latin America & Caribbean (excluding high income)Latin America & the Caribbean (IDA & IBRD countries)LatviaLeast developed countries: UN classificationLebanonLesothoLiberiaLibyaLithuaniaLow & middle incomeLow incomeLower middle incomeLuxembourgMacao SAR, ChinaMacedonia, FYRMadagascarMalawiMalaysiaMaldivesMaliMaltaMarshall IslandsMauritaniaMauritiusMexicoMicronesia, Fed. Sts.Middle East & North AfricaMiddle East & North Africa (excluding high income)Middle East & North Africa (IDA & IBRD countries)Middle incomeMoldovaMongoliaMontenegroMoroccoMozambiqueMyanmarNamibiaNepalNetherlandsNew ZealandNicaraguaNigerNigeriaNorth AmericaNorwayOECD membersOmanOther small statesPacific island small statesPakistanPalauPanamaPapua New GuineaParaguayPeruPhilippinesPolandPortugalPost-demographic dividendPre-demographic dividendQatarRomaniaRussian FederationRwandaSamoaSao Tome and PrincipeSaudi ArabiaSenegalSerbiaSeychellesSierra LeoneSlovak RepublicSloveniaSmall statesSolomon IslandsSouth AfricaSouth AsiaSouth Asia (IDA & IBRD)South SudanSpainSri LankaSt. Kitts and NevisSt. LuciaSt. Vincent and the GrenadinesSub-Saharan Africa Sub-Saharan Africa (excluding high income)Sub-Saharan Africa (IDA & IBRD countries)SudanSurinameSwazilandSwedenSwitzerlandSyrian Arab RepublicTajikistanTanzaniaThailandTimor-LesteTogoTongaTrinidad and TobagoTunisiaTurkeyTurkmenistanTuvaluUgandaUkraineUnited KingdomUnited StatesUpper middle incomeUruguayUzbekistanVanuatuVenezuela, RBVietnamWest Bank and GazaWorldYemen, Rep.ZambiaZimbabwe Timeline:
This timeline shows a graph from 1976 to 2016 of Belgium. No data until 1975. Number of actual observations by date: 41.
Source name:
World Development Indicators
Source organization:
World Bank staff estimates based on IMF balance of payments data, and World Bank and OECD GDP estimates.
Categories, topics:
Economy & Growth, Financial Sector
Last updated:
apr 23, 2017
Indicators value changes by year
At the date of observation
Value
Absolute change
Change from previous value
jan 1, 1976
1.003
+1.003
0.0%
jan 1, 1977
0.922
-0.081
-8.12%
jan 1, 1978
0.906
-0.015
-1.66%
jan 1, 1979
0.94
+0.033
3.68%
jan 1, 1980
0.891
-0.049
-5.19%
jan 1, 1981
0.893
+0.002
0.27%
jan 1, 1982
0.901
+0.008
0.88%
jan 1, 1983
0.904
+0.003
0.35%
jan 1, 1984
0.968
+0.064
7.08%
jan 1, 1985
0.931
-0.037
-3.87%
jan 1, 1986
0.942
+0.011
1.23%
jan 1, 1987
0.91
-0.032
-3.4%
jan 1, 1988
0.849
-0.061
-6.73%
jan 1, 1989
0.876
+0.027
3.23%
jan 1, 1990
1.658
+0.781
89.12%
jan 1, 1991
1.736
+0.078
4.72%
jan 1, 1992
1.877
+0.141
8.14%
jan 1, 1993
1.896
+0.019
1.02%
jan 1, 1994
2.028
+0.131
6.93%
jan 1, 1995
1.874
-0.154
-7.59%
jan 1, 1996
1.705
-0.169
-9.01%
jan 1, 1997
1.758
+0.053
3.13%
jan 1, 1998
1.699
-0.059
-3.38%
jan 1, 1999
1.613
-0.086
-5.04%
jan 1, 2000
1.717
+0.103
6.41%
jan 1, 2001
1.683
-0.033
-1.95%
jan 1, 2002
1.654
-0.03
-1.75%
jan 1, 2003
1.75
+0.096
5.82%
jan 1, 2004
1.81
+0.06
3.42%
jan 1, 2005
1.768
-0.042
-2.31%
jan 1, 2006
1.778
+0.01
0.57%
jan 1, 2007
1.773
-0.005
-0.28%
jan 1, 2008
1.906
+0.133
7.51%
jan 1, 2009
2.021
+0.115
6.01%
jan 1, 2010
2.196
+0.175
8.65%
jan 1, 2011
2.14
-0.055
-2.51%
jan 1, 2012
2.1
-0.041
-1.9%
jan 1, 2013
2.134
+0.034
1.64%
jan 1, 2014
2.158
+0.024
1.12%
jan 1, 2015
2.163
+0.005
0.23%
jan 1, 2016
2.151
-0.012
-0.55%
Ranking of countries by current statistics by years


Comments: