29
/
en
AIzaSyAYiBZKx7MnpbEhh9jyipgxe19OcubqV5w
April 1, 2024
142193
Greece
GRC
true
2
1
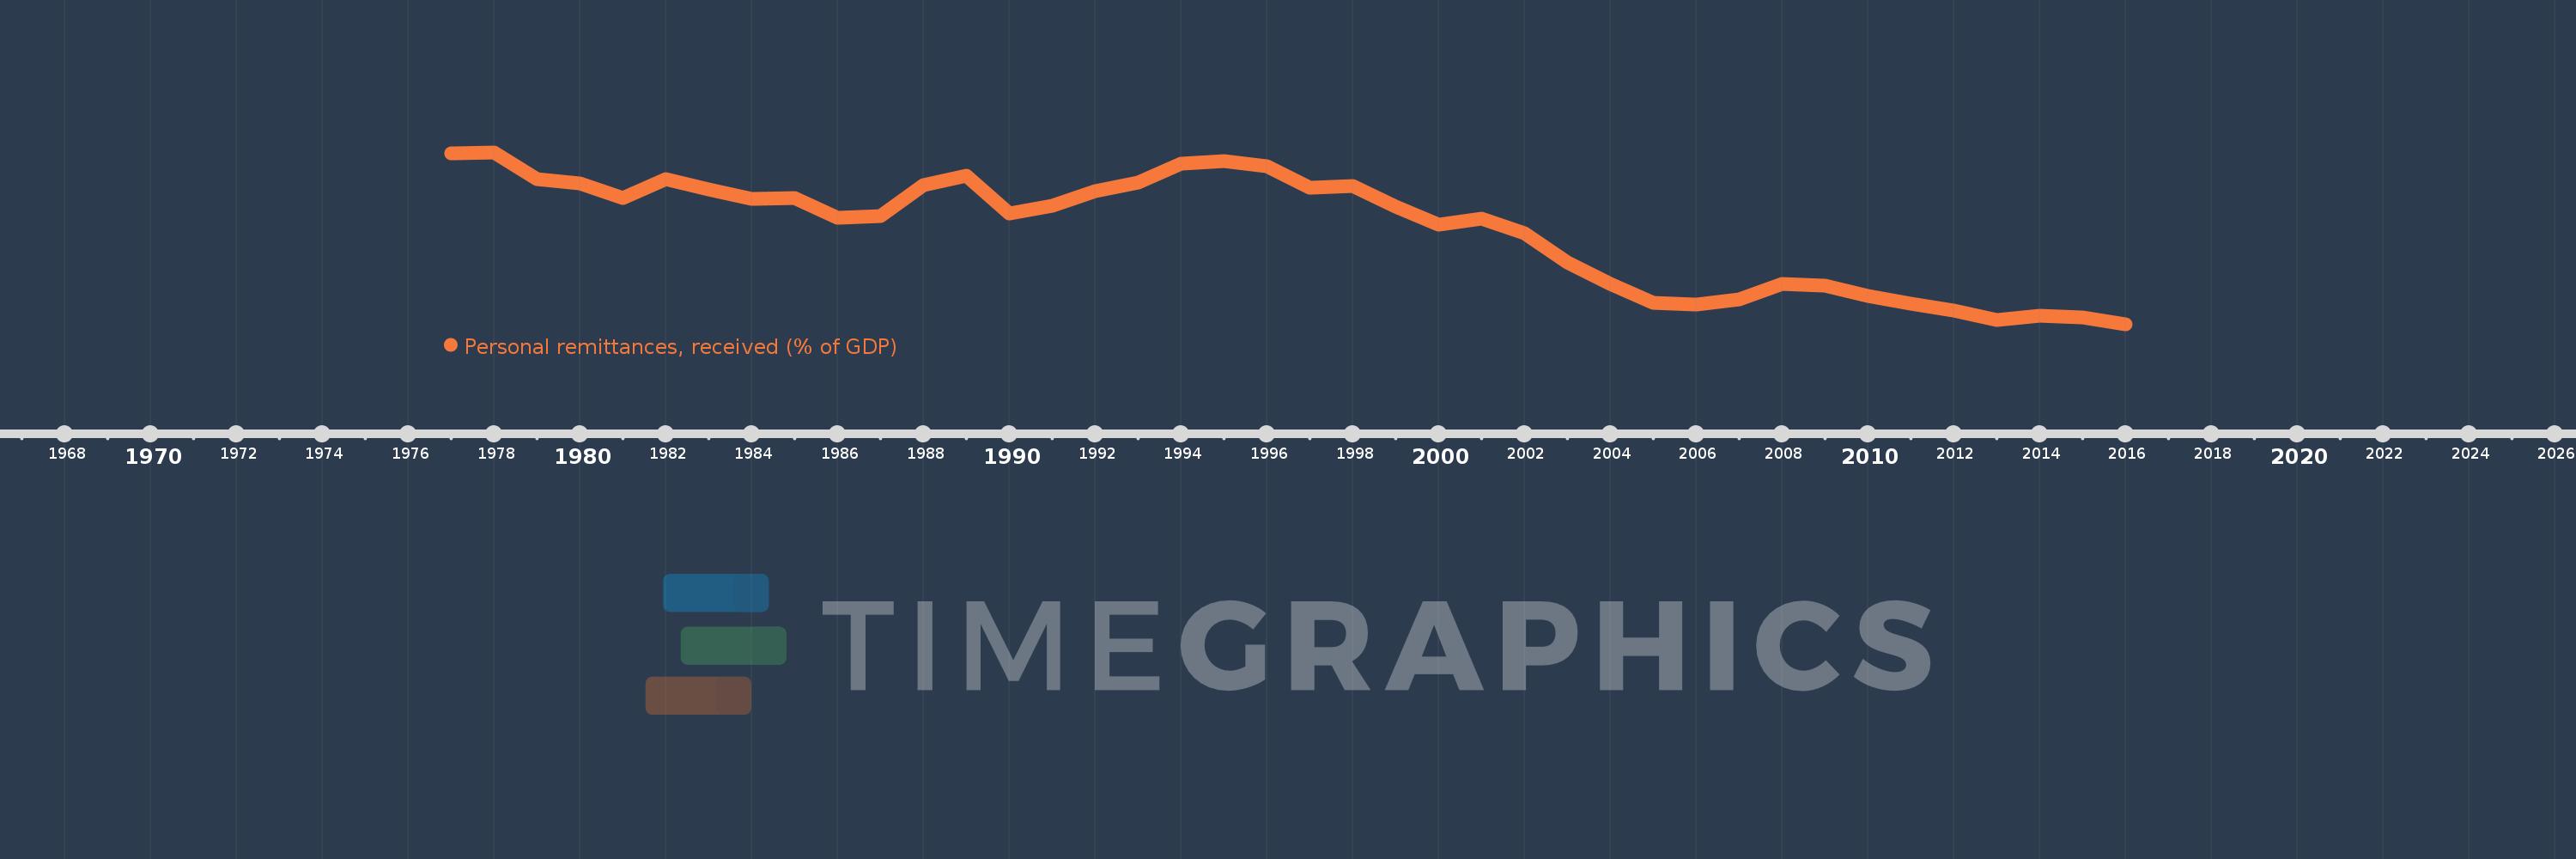
Personal remittances, received (% of GDP)
2016,2015,2014,2013,2012,2011,2010,2009,2008,2007,2006,2005,2004,2003,2002,2001,2000,1999,1998,1997,1996,1995,1994,1993,1992,1991,1990,1989,1988,1987,1986,1985,1984,1983,1982,1981,1980,1979,1978,1977
This statistics in other country:
AfghanistanAlbaniaAlgeriaAngolaAntigua and BarbudaArab WorldArgentinaArmeniaArubaAustraliaAustriaAzerbaijanBangladeshBarbadosBelarusBelgiumBelizeBeninBermudaBhutanBoliviaBosnia and HerzegovinaBotswanaBrazilBulgariaBurkina FasoBurundiCabo VerdeCambodiaCameroonCanadaCaribbean small statesCentral African RepublicCentral Europe and the BalticsChadChileChinaColombiaComorosCongo, Dem. Rep.Congo, Rep.Costa RicaCote d'IvoireCroatiaCyprusCzech RepublicDenmarkDjiboutiDominicaDominican RepublicEarly-demographic dividendEast Asia & PacificEast Asia & Pacific (excluding high income)East Asia & Pacific (IDA & IBRD countries)EcuadorEgypt, Arab Rep.El SalvadorEquatorial GuineaEritreaEstoniaEthiopiaEuro areaEurope & Central AsiaEurope & Central Asia (excluding high income)Europe & Central Asia (IDA & IBRD countries)European UnionFaroe IslandsFijiFinlandFragile and conflict affected situationsFranceGabonGambia, TheGeorgiaGermanyGhanaGreeceGrenadaGuatemalaGuineaGuinea-BissauGuyanaHaitiHeavily indebted poor countries (HIPC)High incomeHondurasHong Kong SAR, ChinaHungaryIBRD onlyIcelandIDA & IBRD totalIDA blendIDA onlyIDA totalIndiaIndonesiaIran, Islamic Rep.IraqIrelandIsraelItalyJamaicaJapanJordanKazakhstanKenyaKiribatiKorea, Rep.KosovoKuwaitKyrgyz RepublicLao PDRLate-demographic dividendLatin America & Caribbean Latin America & Caribbean (excluding high income)Latin America & the Caribbean (IDA & IBRD countries)LatviaLeast developed countries: UN classificationLebanonLesothoLiberiaLibyaLithuaniaLow & middle incomeLow incomeLower middle incomeLuxembourgMacao SAR, ChinaMacedonia, FYRMadagascarMalawiMalaysiaMaldivesMaliMaltaMarshall IslandsMauritaniaMauritiusMexicoMicronesia, Fed. Sts.Middle East & North AfricaMiddle East & North Africa (excluding high income)Middle East & North Africa (IDA & IBRD countries)Middle incomeMoldovaMongoliaMontenegroMoroccoMozambiqueMyanmarNamibiaNepalNetherlandsNew ZealandNicaraguaNigerNigeriaNorth AmericaNorwayOECD membersOmanOther small statesPacific island small statesPakistanPalauPanamaPapua New GuineaParaguayPeruPhilippinesPolandPortugalPost-demographic dividendPre-demographic dividendQatarRomaniaRussian FederationRwandaSamoaSao Tome and PrincipeSaudi ArabiaSenegalSerbiaSeychellesSierra LeoneSlovak RepublicSloveniaSmall statesSolomon IslandsSouth AfricaSouth AsiaSouth Asia (IDA & IBRD)South SudanSpainSri LankaSt. Kitts and NevisSt. LuciaSt. Vincent and the GrenadinesSub-Saharan Africa Sub-Saharan Africa (excluding high income)Sub-Saharan Africa (IDA & IBRD countries)SudanSurinameSwazilandSwedenSwitzerlandSyrian Arab RepublicTajikistanTanzaniaThailandTimor-LesteTogoTongaTrinidad and TobagoTunisiaTurkeyTurkmenistanTuvaluUgandaUkraineUnited KingdomUnited StatesUpper middle incomeUruguayUzbekistanVanuatuVenezuela, RBVietnamWest Bank and GazaWorldYemen, Rep.ZambiaZimbabwe Timeline:
This timeline shows a graph from 1977 to 2016 of Greece. No data until 1976. Number of actual observations by date: 40.
Source name:
World Development Indicators
Source organization:
World Bank staff estimates based on IMF balance of payments data, and World Bank and OECD GDP estimates.
Categories, topics:
Economy & Growth, Financial Sector
Last updated:
apr 23, 2017
Indicators value changes by year
At the date of observation
Value
Absolute change
Change from previous value
jan 1, 1977
2.584
+2.584
0.0%
jan 1, 1978
2.598
+0.014
0.56%
jan 1, 1979
2.234
-0.364
-14.02%
jan 1, 1980
2.168
-0.066
-2.97%
jan 1, 1981
1.969
-0.199
-9.16%
jan 1, 1982
2.233
+0.264
13.42%
jan 1, 1983
2.087
-0.146
-6.54%
jan 1, 1984
1.95
-0.137
-6.56%
jan 1, 1985
1.968
+0.018
0.91%
jan 1, 1986
1.688
-0.28
-14.25%
jan 1, 1987
1.715
+0.028
1.64%
jan 1, 1988
2.143
+0.428
24.95%
jan 1, 1989
2.278
+0.135
6.28%
jan 1, 1990
1.752
-0.526
-23.08%
jan 1, 1991
1.856
+0.104
5.95%
jan 1, 1992
2.067
+0.211
11.34%
jan 1, 1993
2.178
+0.111
5.37%
jan 1, 1994
2.44
+0.262
12.05%
jan 1, 1995
2.475
+0.035
1.44%
jan 1, 1996
2.401
-0.074
-3.01%
jan 1, 1997
2.111
-0.29
-12.07%
jan 1, 1998
2.139
+0.028
1.33%
jan 1, 1999
1.851
-0.288
-13.47%
jan 1, 2000
1.602
-0.248
-13.42%
jan 1, 2001
1.686
+0.083
5.2%
jan 1, 2002
1.479
-0.207
-12.28%
jan 1, 2003
1.078
-0.4
-27.08%
jan 1, 2004
0.774
-0.304
-28.19%
jan 1, 2005
0.516
-0.258
-33.33%
jan 1, 2006
0.492
-0.024
-4.63%
jan 1, 2007
0.564
+0.072
14.62%
jan 1, 2008
0.78
+0.215
38.17%
jan 1, 2009
0.758
-0.022
-2.8%
jan 1, 2010
0.612
-0.146
-19.23%
jan 1, 2011
0.501
-0.111
-18.2%
jan 1, 2012
0.412
-0.089
-17.69%
jan 1, 2013
0.277
-0.135
-32.73%
jan 1, 2014
0.336
+0.058
20.99%
jan 1, 2015
0.311
-0.024
-7.24%
jan 1, 2016
0.22
-0.091
-29.29%
Ranking of countries by current statistics by years


Comments: