29
/
en
AIzaSyAYiBZKx7MnpbEhh9jyipgxe19OcubqV5w
April 1, 2024
256713
Sweden
SWE
true
2
1
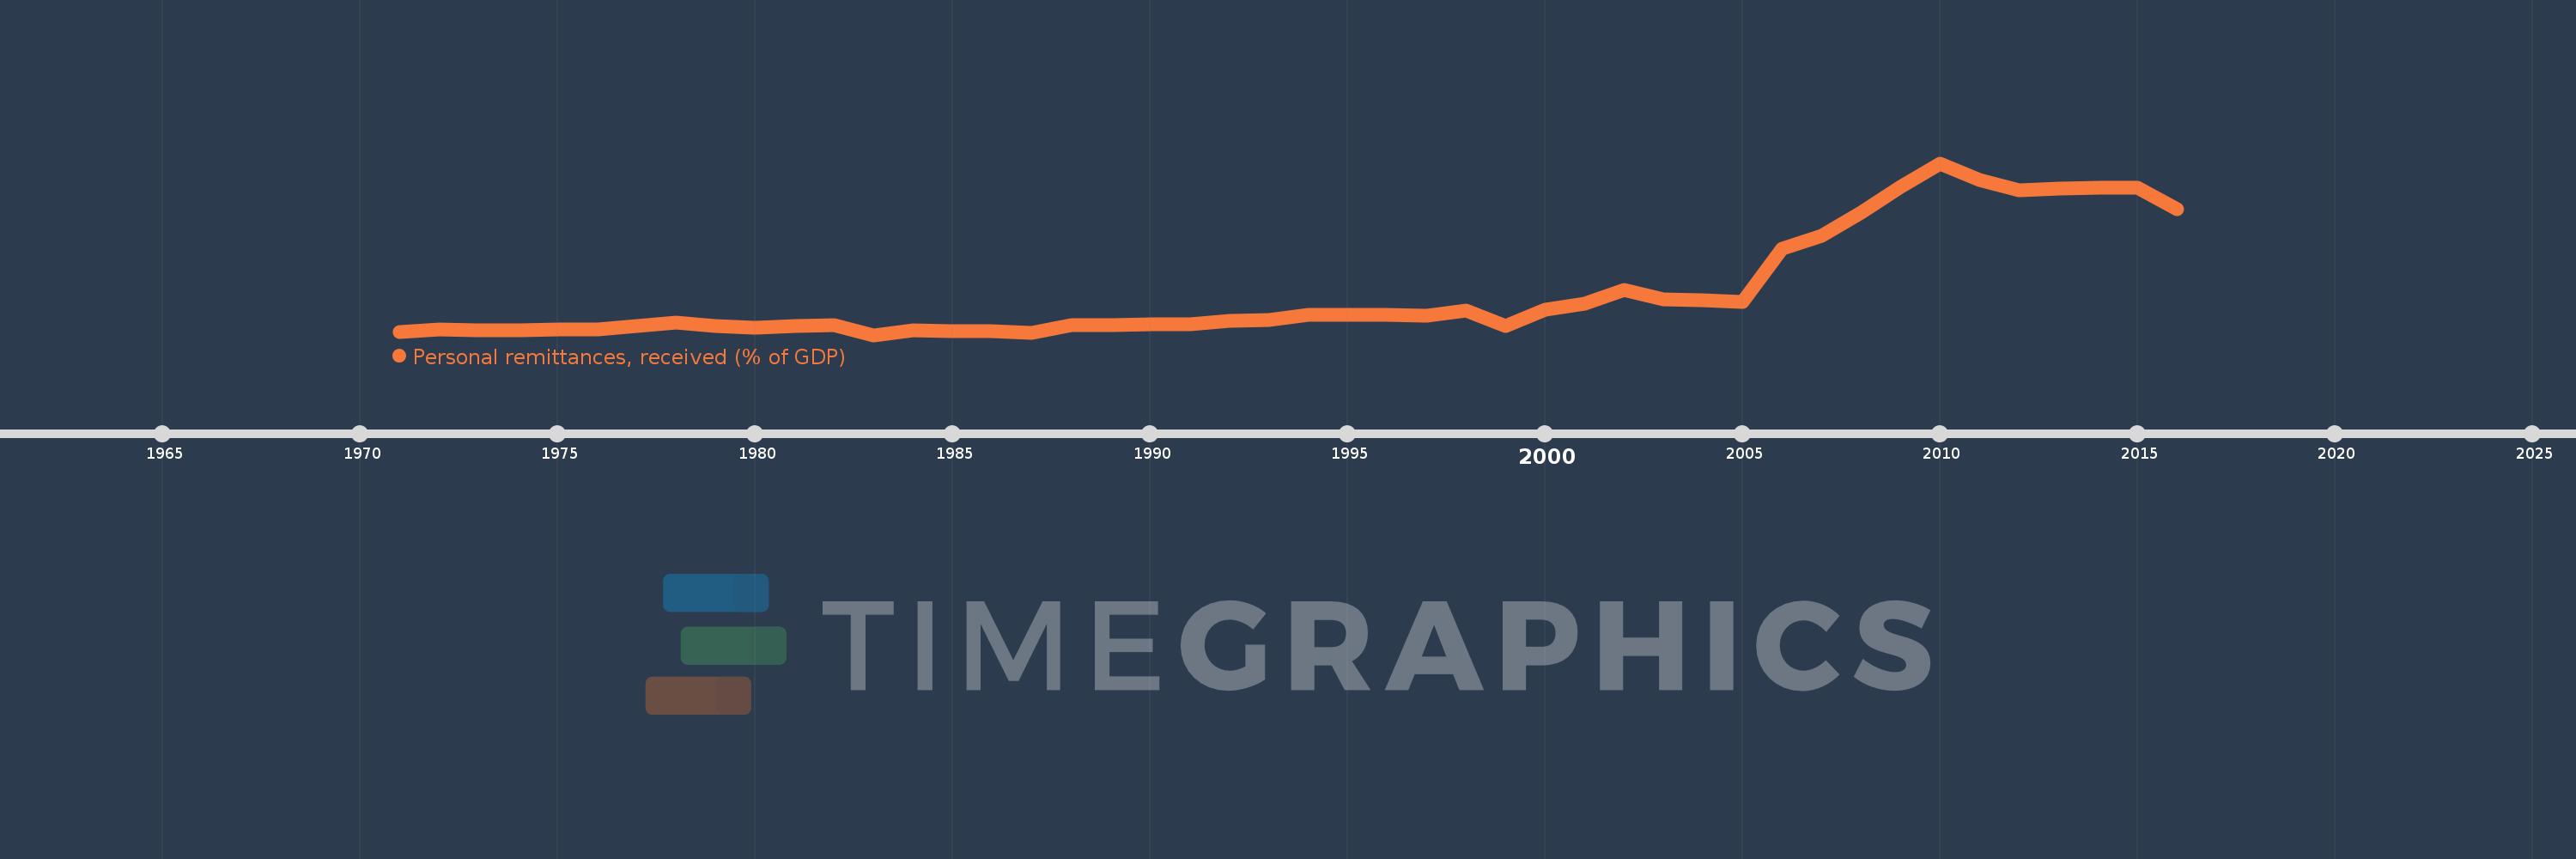
Personal remittances, received (% of GDP)
2016,2015,2014,2013,2012,2011,2010,2009,2008,2007,2006,2005,2004,2003,2002,2001,2000,1999,1998,1997,1996,1995,1994,1993,1992,1991,1990,1989,1988,1987,1986,1985,1984,1983,1982,1981,1980,1979,1978,1977,1976,1975,1974,1973,1972,1971
This statistics in other country:
AfghanistanAlbaniaAlgeriaAngolaAntigua and BarbudaArab WorldArgentinaArmeniaArubaAustraliaAustriaAzerbaijanBangladeshBarbadosBelarusBelgiumBelizeBeninBermudaBhutanBoliviaBosnia and HerzegovinaBotswanaBrazilBulgariaBurkina FasoBurundiCabo VerdeCambodiaCameroonCanadaCaribbean small statesCentral African RepublicCentral Europe and the BalticsChadChileChinaColombiaComorosCongo, Dem. Rep.Congo, Rep.Costa RicaCote d'IvoireCroatiaCyprusCzech RepublicDenmarkDjiboutiDominicaDominican RepublicEarly-demographic dividendEast Asia & PacificEast Asia & Pacific (excluding high income)East Asia & Pacific (IDA & IBRD countries)EcuadorEgypt, Arab Rep.El SalvadorEquatorial GuineaEritreaEstoniaEthiopiaEuro areaEurope & Central AsiaEurope & Central Asia (excluding high income)Europe & Central Asia (IDA & IBRD countries)European UnionFaroe IslandsFijiFinlandFragile and conflict affected situationsFranceGabonGambia, TheGeorgiaGermanyGhanaGreeceGrenadaGuatemalaGuineaGuinea-BissauGuyanaHaitiHeavily indebted poor countries (HIPC)High incomeHondurasHong Kong SAR, ChinaHungaryIBRD onlyIcelandIDA & IBRD totalIDA blendIDA onlyIDA totalIndiaIndonesiaIran, Islamic Rep.IraqIrelandIsraelItalyJamaicaJapanJordanKazakhstanKenyaKiribatiKorea, Rep.KosovoKuwaitKyrgyz RepublicLao PDRLate-demographic dividendLatin America & Caribbean Latin America & Caribbean (excluding high income)Latin America & the Caribbean (IDA & IBRD countries)LatviaLeast developed countries: UN classificationLebanonLesothoLiberiaLibyaLithuaniaLow & middle incomeLow incomeLower middle incomeLuxembourgMacao SAR, ChinaMacedonia, FYRMadagascarMalawiMalaysiaMaldivesMaliMaltaMarshall IslandsMauritaniaMauritiusMexicoMicronesia, Fed. Sts.Middle East & North AfricaMiddle East & North Africa (excluding high income)Middle East & North Africa (IDA & IBRD countries)Middle incomeMoldovaMongoliaMontenegroMoroccoMozambiqueMyanmarNamibiaNepalNetherlandsNew ZealandNicaraguaNigerNigeriaNorth AmericaNorwayOECD membersOmanOther small statesPacific island small statesPakistanPalauPanamaPapua New GuineaParaguayPeruPhilippinesPolandPortugalPost-demographic dividendPre-demographic dividendQatarRomaniaRussian FederationRwandaSamoaSao Tome and PrincipeSaudi ArabiaSenegalSerbiaSeychellesSierra LeoneSlovak RepublicSloveniaSmall statesSolomon IslandsSouth AfricaSouth AsiaSouth Asia (IDA & IBRD)South SudanSpainSri LankaSt. Kitts and NevisSt. LuciaSt. Vincent and the GrenadinesSub-Saharan Africa Sub-Saharan Africa (excluding high income)Sub-Saharan Africa (IDA & IBRD countries)SudanSurinameSwazilandSwedenSwitzerlandSyrian Arab RepublicTajikistanTanzaniaThailandTimor-LesteTogoTongaTrinidad and TobagoTunisiaTurkeyTurkmenistanTuvaluUgandaUkraineUnited KingdomUnited StatesUpper middle incomeUruguayUzbekistanVanuatuVenezuela, RBVietnamWest Bank and GazaWorldYemen, Rep.ZambiaZimbabwe Timeline:
This timeline shows a graph from 1971 to 2016 of Sweden. No data until 1970. Number of actual observations by date: 46.
Source name:
World Development Indicators
Source organization:
World Bank staff estimates based on IMF balance of payments data, and World Bank and OECD GDP estimates.
Categories, topics:
Economy & Growth, Financial Sector
Last updated:
apr 23, 2017
Indicators value changes by year
At the date of observation
Value
Absolute change
Change from previous value
jan 1, 1971
0.015
+0.015
0.0%
jan 1, 1972
0.029
+0.013
84.98%
jan 1, 1973
0.026
-0.002
-8.61%
jan 1, 1974
0.027
+0.001
4.84%
jan 1, 1975
0.031
+0.004
13.82%
jan 1, 1976
0.032
+0.001
2.89%
jan 1, 1977
0.047
+0.015
46.56%
jan 1, 1978
0.065
+0.018
38.3%
jan 1, 1979
0.047
-0.018
-27.22%
jan 1, 1980
0.038
-0.009
-19.01%
jan 1, 1981
0.047
+0.009
23.0%
jan 1, 1982
0.053
+0.006
12.32%
jan 1, 1983
0.0
-0.053
-99.77%
jan 1, 1984
0.024
+0.024
19.51K%
jan 1, 1985
0.021
-0.003
-11.89%
jan 1, 1986
0.021
0.0
-0.64%
jan 1, 1987
0.012
-0.008
-40.11%
jan 1, 1988
0.054
+0.042
337.97%
jan 1, 1989
0.051
-0.003
-6.05%
jan 1, 1990
0.059
+0.008
15.85%
jan 1, 1991
0.059
0.0
-0.26%
jan 1, 1992
0.077
+0.017
29.57%
jan 1, 1993
0.083
+0.006
8.22%
jan 1, 1994
0.11
+0.027
33.04%
jan 1, 1995
0.11
+0.0
0.07%
jan 1, 1996
0.109
-0.001
-1.25%
jan 1, 1997
0.105
-0.004
-3.98%
jan 1, 1998
0.13
+0.026
24.63%
jan 1, 1999
0.047
-0.083
-63.89%
jan 1, 2000
0.134
+0.087
185.56%
jan 1, 2001
0.169
+0.034
25.39%
jan 1, 2002
0.241
+0.072
43.01%
jan 1, 2003
0.194
-0.047
-19.48%
jan 1, 2004
0.187
-0.007
-3.54%
jan 1, 2005
0.177
-0.01
-5.3%
jan 1, 2006
0.466
+0.288
162.7%
jan 1, 2007
0.535
+0.069
14.79%
jan 1, 2008
0.657
+0.123
22.94%
jan 1, 2009
0.797
+0.14
21.27%
jan 1, 2010
0.924
+0.127
15.9%
jan 1, 2011
0.832
-0.092
-9.96%
jan 1, 2012
0.779
-0.053
-6.36%
jan 1, 2013
0.789
+0.011
1.38%
jan 1, 2014
0.794
+0.004
0.52%
jan 1, 2015
0.794
+0.001
0.1%
jan 1, 2016
0.679
-0.116
-14.57%
Ranking of countries by current statistics by years


Comments: