29
/
en
AIzaSyAYiBZKx7MnpbEhh9jyipgxe19OcubqV5w
April 1, 2024
35287
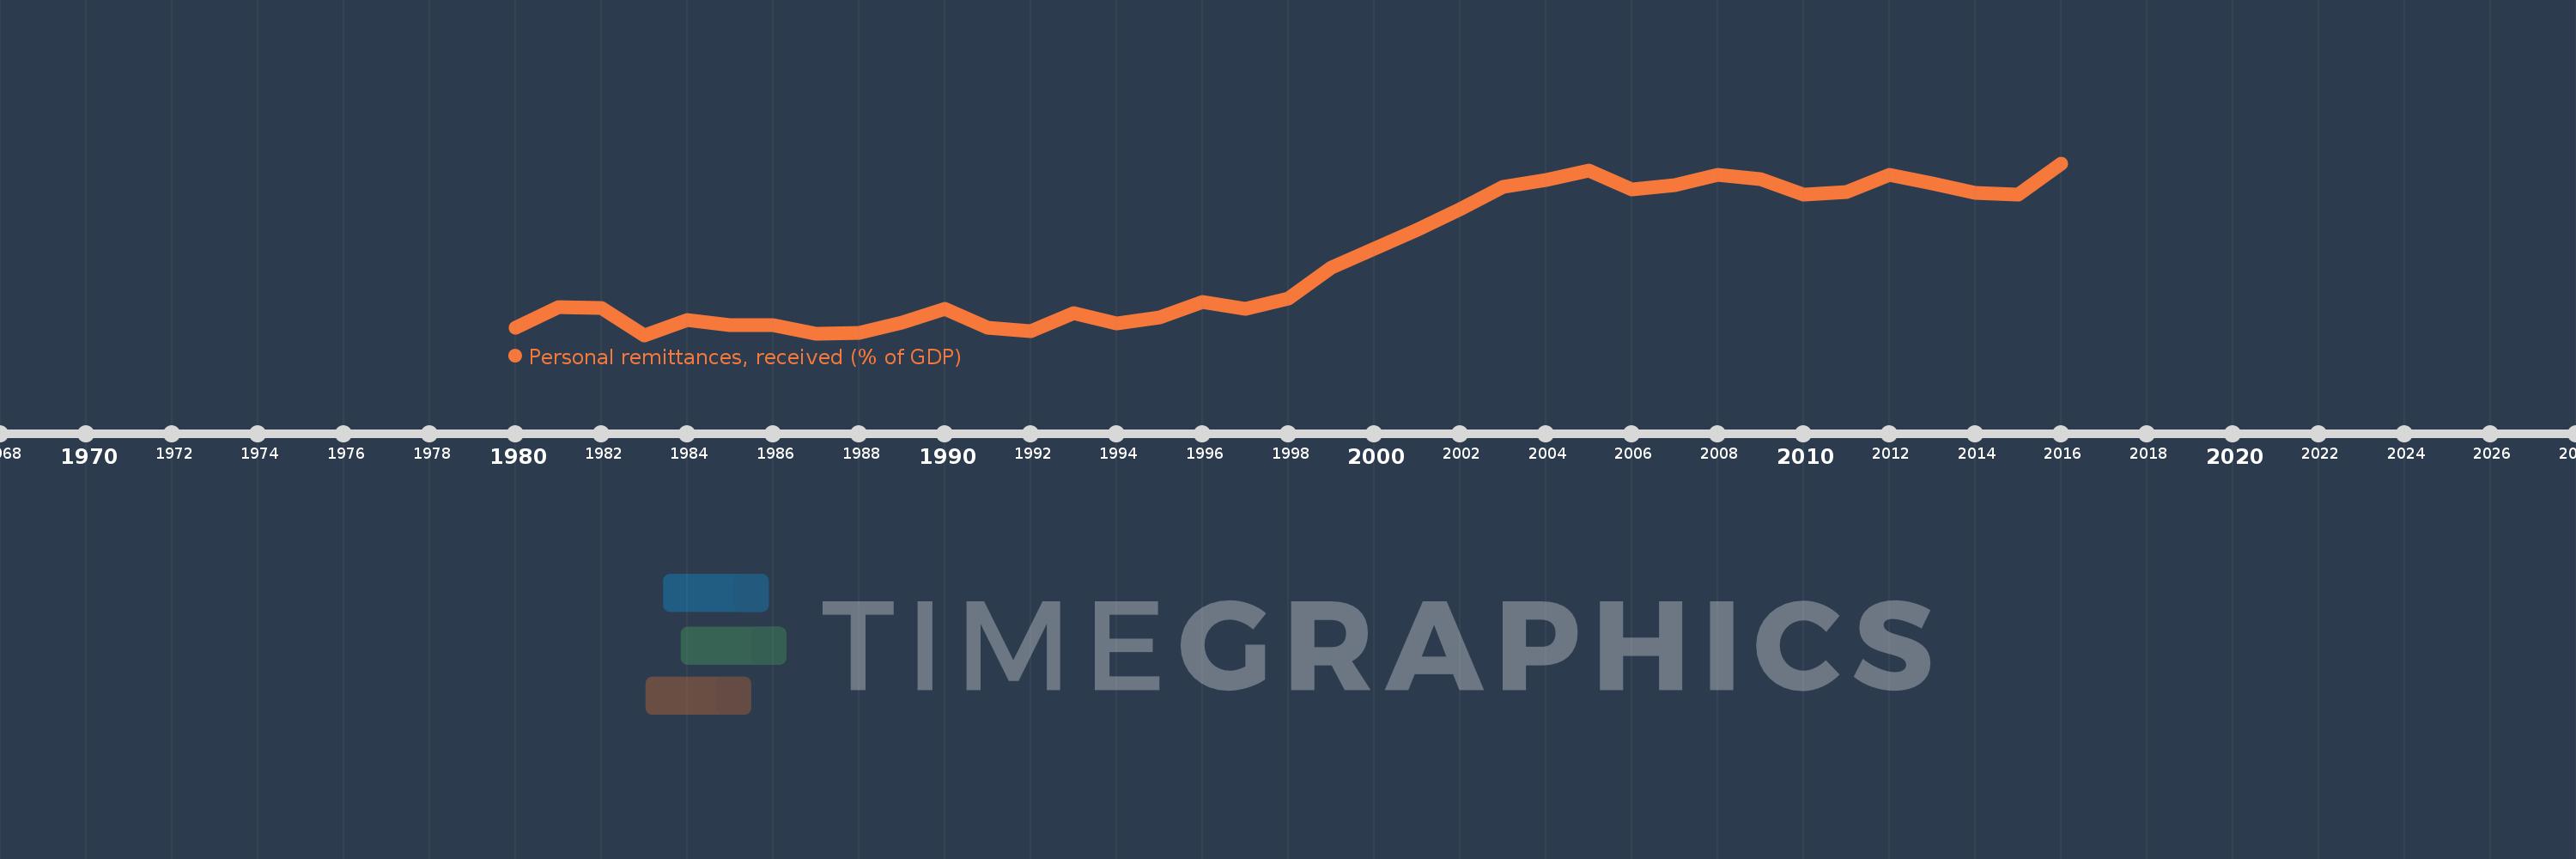
Heavily indebted poor countries (HIPC)
HPC
false
2
1
Personal remittances, received (% of GDP)
2016,2015,2014,2013,2012,2011,2010,2009,2008,2007,2006,2005,2004,2003,2002,2001,2000,1999,1998,1997,1996,1995,1994,1993,1992,1991,1990,1989,1988,1987,1986,1985,1984,1983,1982,1981,1980
This statistics in other country:
AfghanistanAlbaniaAlgeriaAngolaAntigua and BarbudaArab WorldArgentinaArmeniaArubaAustraliaAustriaAzerbaijanBangladeshBarbadosBelarusBelgiumBelizeBeninBermudaBhutanBoliviaBosnia and HerzegovinaBotswanaBrazilBulgariaBurkina FasoBurundiCabo VerdeCambodiaCameroonCanadaCaribbean small statesCentral African RepublicCentral Europe and the BalticsChadChileChinaColombiaComorosCongo, Dem. Rep.Congo, Rep.Costa RicaCote d'IvoireCroatiaCyprusCzech RepublicDenmarkDjiboutiDominicaDominican RepublicEarly-demographic dividendEast Asia & PacificEast Asia & Pacific (excluding high income)East Asia & Pacific (IDA & IBRD countries)EcuadorEgypt, Arab Rep.El SalvadorEquatorial GuineaEritreaEstoniaEthiopiaEuro areaEurope & Central AsiaEurope & Central Asia (excluding high income)Europe & Central Asia (IDA & IBRD countries)European UnionFaroe IslandsFijiFinlandFragile and conflict affected situationsFranceGabonGambia, TheGeorgiaGermanyGhanaGreeceGrenadaGuatemalaGuineaGuinea-BissauGuyanaHaitiHeavily indebted poor countries (HIPC)High incomeHondurasHong Kong SAR, ChinaHungaryIBRD onlyIcelandIDA & IBRD totalIDA blendIDA onlyIDA totalIndiaIndonesiaIran, Islamic Rep.IraqIrelandIsraelItalyJamaicaJapanJordanKazakhstanKenyaKiribatiKorea, Rep.KosovoKuwaitKyrgyz RepublicLao PDRLate-demographic dividendLatin America & Caribbean Latin America & Caribbean (excluding high income)Latin America & the Caribbean (IDA & IBRD countries)LatviaLeast developed countries: UN classificationLebanonLesothoLiberiaLibyaLithuaniaLow & middle incomeLow incomeLower middle incomeLuxembourgMacao SAR, ChinaMacedonia, FYRMadagascarMalawiMalaysiaMaldivesMaliMaltaMarshall IslandsMauritaniaMauritiusMexicoMicronesia, Fed. Sts.Middle East & North AfricaMiddle East & North Africa (excluding high income)Middle East & North Africa (IDA & IBRD countries)Middle incomeMoldovaMongoliaMontenegroMoroccoMozambiqueMyanmarNamibiaNepalNetherlandsNew ZealandNicaraguaNigerNigeriaNorth AmericaNorwayOECD membersOmanOther small statesPacific island small statesPakistanPalauPanamaPapua New GuineaParaguayPeruPhilippinesPolandPortugalPost-demographic dividendPre-demographic dividendQatarRomaniaRussian FederationRwandaSamoaSao Tome and PrincipeSaudi ArabiaSenegalSerbiaSeychellesSierra LeoneSlovak RepublicSloveniaSmall statesSolomon IslandsSouth AfricaSouth AsiaSouth Asia (IDA & IBRD)South SudanSpainSri LankaSt. Kitts and NevisSt. LuciaSt. Vincent and the GrenadinesSub-Saharan Africa Sub-Saharan Africa (excluding high income)Sub-Saharan Africa (IDA & IBRD countries)SudanSurinameSwazilandSwedenSwitzerlandSyrian Arab RepublicTajikistanTanzaniaThailandTimor-LesteTogoTongaTrinidad and TobagoTunisiaTurkeyTurkmenistanTuvaluUgandaUkraineUnited KingdomUnited StatesUpper middle incomeUruguayUzbekistanVanuatuVenezuela, RBVietnamWest Bank and GazaWorldYemen, Rep.ZambiaZimbabwe Timeline:
This timeline shows a graph from 1980 to 2016 of Heavily indebted poor countries (HIPC). No data until 1979. Number of actual observations by date: 37.
Source name:
World Development Indicators
Source organization:
World Bank staff estimates based on IMF balance of payments data, and World Bank and OECD GDP estimates.
Categories, topics:
Economy & Growth, Financial Sector
Last updated:
apr 23, 2017
Indicators value changes by year
At the date of observation
Value
Absolute change
Change from previous value
jan 1, 1980
0.911
+0.911
0.0%
jan 1, 1981
1.266
+0.355
39.0%
jan 1, 1982
1.255
-0.012
-0.91%
jan 1, 1983
0.788
-0.467
-37.22%
jan 1, 1984
1.051
+0.263
33.38%
jan 1, 1985
0.96
-0.09
-8.59%
jan 1, 1986
0.96
0.0
-0.04%
jan 1, 1987
0.81
-0.15
-15.59%
jan 1, 1988
0.83
+0.019
2.38%
jan 1, 1989
1.006
+0.176
21.26%
jan 1, 1990
1.239
+0.233
23.19%
jan 1, 1991
0.911
-0.328
-26.49%
jan 1, 1992
0.857
-0.054
-5.98%
jan 1, 1993
1.165
+0.309
36.05%
jan 1, 1994
0.993
-0.172
-14.78%
jan 1, 1995
1.097
+0.104
10.5%
jan 1, 1996
1.356
+0.258
23.53%
jan 1, 1997
1.237
-0.118
-8.73%
jan 1, 1998
1.427
+0.19
15.34%
jan 1, 1999
1.955
+0.528
36.97%
jan 1, 2000
2.281
+0.326
16.68%
jan 1, 2001
2.622
+0.341
14.94%
jan 1, 2002
2.969
+0.347
13.24%
jan 1, 2003
3.364
+0.395
13.31%
jan 1, 2004
3.475
+0.111
3.3%
jan 1, 2005
3.652
+0.177
5.09%
jan 1, 2006
3.313
-0.339
-9.29%
jan 1, 2007
3.387
+0.074
2.25%
jan 1, 2008
3.565
+0.178
5.24%
jan 1, 2009
3.492
-0.073
-2.05%
jan 1, 2010
3.232
-0.259
-7.42%
jan 1, 2011
3.266
+0.034
1.05%
jan 1, 2012
3.567
+0.301
9.21%
jan 1, 2013
3.423
-0.144
-4.03%
jan 1, 2014
3.259
-0.164
-4.8%
jan 1, 2015
3.231
-0.029
-0.88%
jan 1, 2016
3.773
+0.542
16.78%
Ranking of countries by current statistics by years


Comments: