29
/
en
AIzaSyAYiBZKx7MnpbEhh9jyipgxe19OcubqV5w
April 1, 2024
156480
Indonesia
IDN
true
2
1
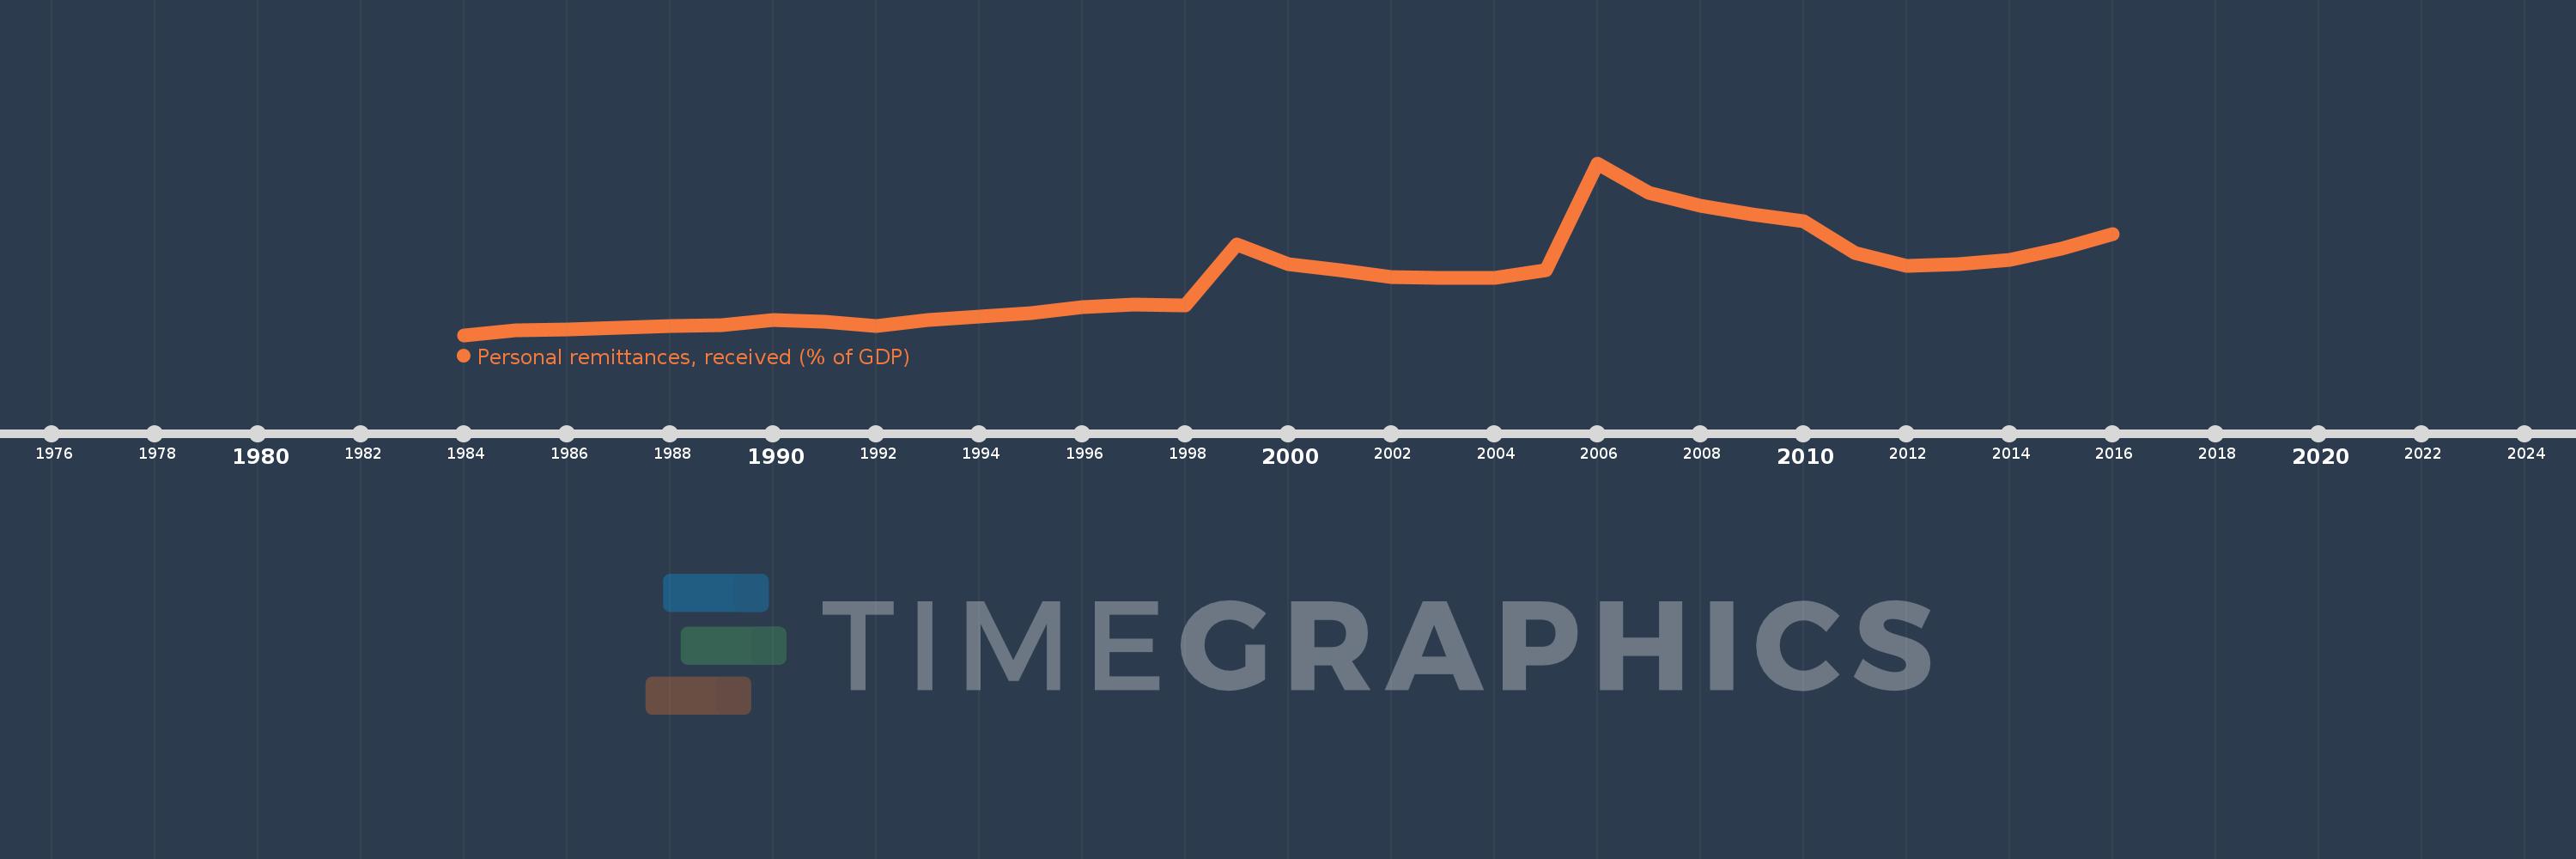
Personal remittances, received (% of GDP)
2016,2015,2014,2013,2012,2011,2010,2009,2008,2007,2006,2005,2004,2003,2002,2001,2000,1999,1998,1997,1996,1995,1994,1993,1992,1991,1990,1989,1988,1987,1986,1985,1984
This statistics in other country:
AfghanistanAlbaniaAlgeriaAngolaAntigua and BarbudaArab WorldArgentinaArmeniaArubaAustraliaAustriaAzerbaijanBangladeshBarbadosBelarusBelgiumBelizeBeninBermudaBhutanBoliviaBosnia and HerzegovinaBotswanaBrazilBulgariaBurkina FasoBurundiCabo VerdeCambodiaCameroonCanadaCaribbean small statesCentral African RepublicCentral Europe and the BalticsChadChileChinaColombiaComorosCongo, Dem. Rep.Congo, Rep.Costa RicaCote d'IvoireCroatiaCyprusCzech RepublicDenmarkDjiboutiDominicaDominican RepublicEarly-demographic dividendEast Asia & PacificEast Asia & Pacific (excluding high income)East Asia & Pacific (IDA & IBRD countries)EcuadorEgypt, Arab Rep.El SalvadorEquatorial GuineaEritreaEstoniaEthiopiaEuro areaEurope & Central AsiaEurope & Central Asia (excluding high income)Europe & Central Asia (IDA & IBRD countries)European UnionFaroe IslandsFijiFinlandFragile and conflict affected situationsFranceGabonGambia, TheGeorgiaGermanyGhanaGreeceGrenadaGuatemalaGuineaGuinea-BissauGuyanaHaitiHeavily indebted poor countries (HIPC)High incomeHondurasHong Kong SAR, ChinaHungaryIBRD onlyIcelandIDA & IBRD totalIDA blendIDA onlyIDA totalIndiaIndonesiaIran, Islamic Rep.IraqIrelandIsraelItalyJamaicaJapanJordanKazakhstanKenyaKiribatiKorea, Rep.KosovoKuwaitKyrgyz RepublicLao PDRLate-demographic dividendLatin America & Caribbean Latin America & Caribbean (excluding high income)Latin America & the Caribbean (IDA & IBRD countries)LatviaLeast developed countries: UN classificationLebanonLesothoLiberiaLibyaLithuaniaLow & middle incomeLow incomeLower middle incomeLuxembourgMacao SAR, ChinaMacedonia, FYRMadagascarMalawiMalaysiaMaldivesMaliMaltaMarshall IslandsMauritaniaMauritiusMexicoMicronesia, Fed. Sts.Middle East & North AfricaMiddle East & North Africa (excluding high income)Middle East & North Africa (IDA & IBRD countries)Middle incomeMoldovaMongoliaMontenegroMoroccoMozambiqueMyanmarNamibiaNepalNetherlandsNew ZealandNicaraguaNigerNigeriaNorth AmericaNorwayOECD membersOmanOther small statesPacific island small statesPakistanPalauPanamaPapua New GuineaParaguayPeruPhilippinesPolandPortugalPost-demographic dividendPre-demographic dividendQatarRomaniaRussian FederationRwandaSamoaSao Tome and PrincipeSaudi ArabiaSenegalSerbiaSeychellesSierra LeoneSlovak RepublicSloveniaSmall statesSolomon IslandsSouth AfricaSouth AsiaSouth Asia (IDA & IBRD)South SudanSpainSri LankaSt. Kitts and NevisSt. LuciaSt. Vincent and the GrenadinesSub-Saharan Africa Sub-Saharan Africa (excluding high income)Sub-Saharan Africa (IDA & IBRD countries)SudanSurinameSwazilandSwedenSwitzerlandSyrian Arab RepublicTajikistanTanzaniaThailandTimor-LesteTogoTongaTrinidad and TobagoTunisiaTurkeyTurkmenistanTuvaluUgandaUkraineUnited KingdomUnited StatesUpper middle incomeUruguayUzbekistanVanuatuVenezuela, RBVietnamWest Bank and GazaWorldYemen, Rep.ZambiaZimbabwe Timeline:
This timeline shows a graph from 1984 to 2016 of Indonesia. No data until 1983. Number of actual observations by date: 33.
Source name:
World Development Indicators
Source organization:
World Bank staff estimates based on IMF balance of payments data, and World Bank and OECD GDP estimates.
Categories, topics:
Economy & Growth, Financial Sector
Last updated:
apr 23, 2017
Indicators value changes by year
At the date of observation
Value
Absolute change
Change from previous value
jan 1, 1984
0.012
+0.012
0.0%
jan 1, 1985
0.062
+0.05
406.26%
jan 1, 1986
0.072
+0.009
14.51%
jan 1, 1987
0.089
+0.017
24.16%
jan 1, 1988
0.113
+0.024
27.55%
jan 1, 1989
0.117
+0.004
3.69%
jan 1, 1990
0.177
+0.059
50.56%
jan 1, 1991
0.156
-0.02
-11.55%
jan 1, 1992
0.111
-0.045
-28.73%
jan 1, 1993
0.179
+0.067
60.46%
jan 1, 1994
0.219
+0.04
22.42%
jan 1, 1995
0.254
+0.035
15.91%
jan 1, 1996
0.322
+0.068
26.88%
jan 1, 1997
0.35
+0.028
8.7%
jan 1, 1998
0.336
-0.014
-4.01%
jan 1, 1999
1.004
+0.668
198.74%
jan 1, 2000
0.792
-0.212
-21.09%
jan 1, 2001
0.721
-0.071
-8.95%
jan 1, 2002
0.652
-0.069
-9.61%
jan 1, 2003
0.643
-0.009
-1.31%
jan 1, 2004
0.634
-0.009
-1.45%
jan 1, 2005
0.727
+0.093
14.59%
jan 1, 2006
1.896
+1.169
160.9%
jan 1, 2007
1.57
-0.326
-17.21%
jan 1, 2008
1.429
-0.141
-8.99%
jan 1, 2009
1.332
-0.097
-6.79%
jan 1, 2010
1.259
-0.073
-5.46%
jan 1, 2011
0.916
-0.343
-27.25%
jan 1, 2012
0.775
-0.141
-15.34%
jan 1, 2013
0.786
+0.01
1.34%
jan 1, 2014
0.834
+0.049
6.2%
jan 1, 2015
0.96
+0.126
15.08%
jan 1, 2016
1.121
+0.16
16.7%
Ranking of countries by current statistics by years


Comments: