29
/
en
AIzaSyAYiBZKx7MnpbEhh9jyipgxe19OcubqV5w
April 1, 2024
31987
Europe & Central Asia (excluding high income)
ECA
false
2
1
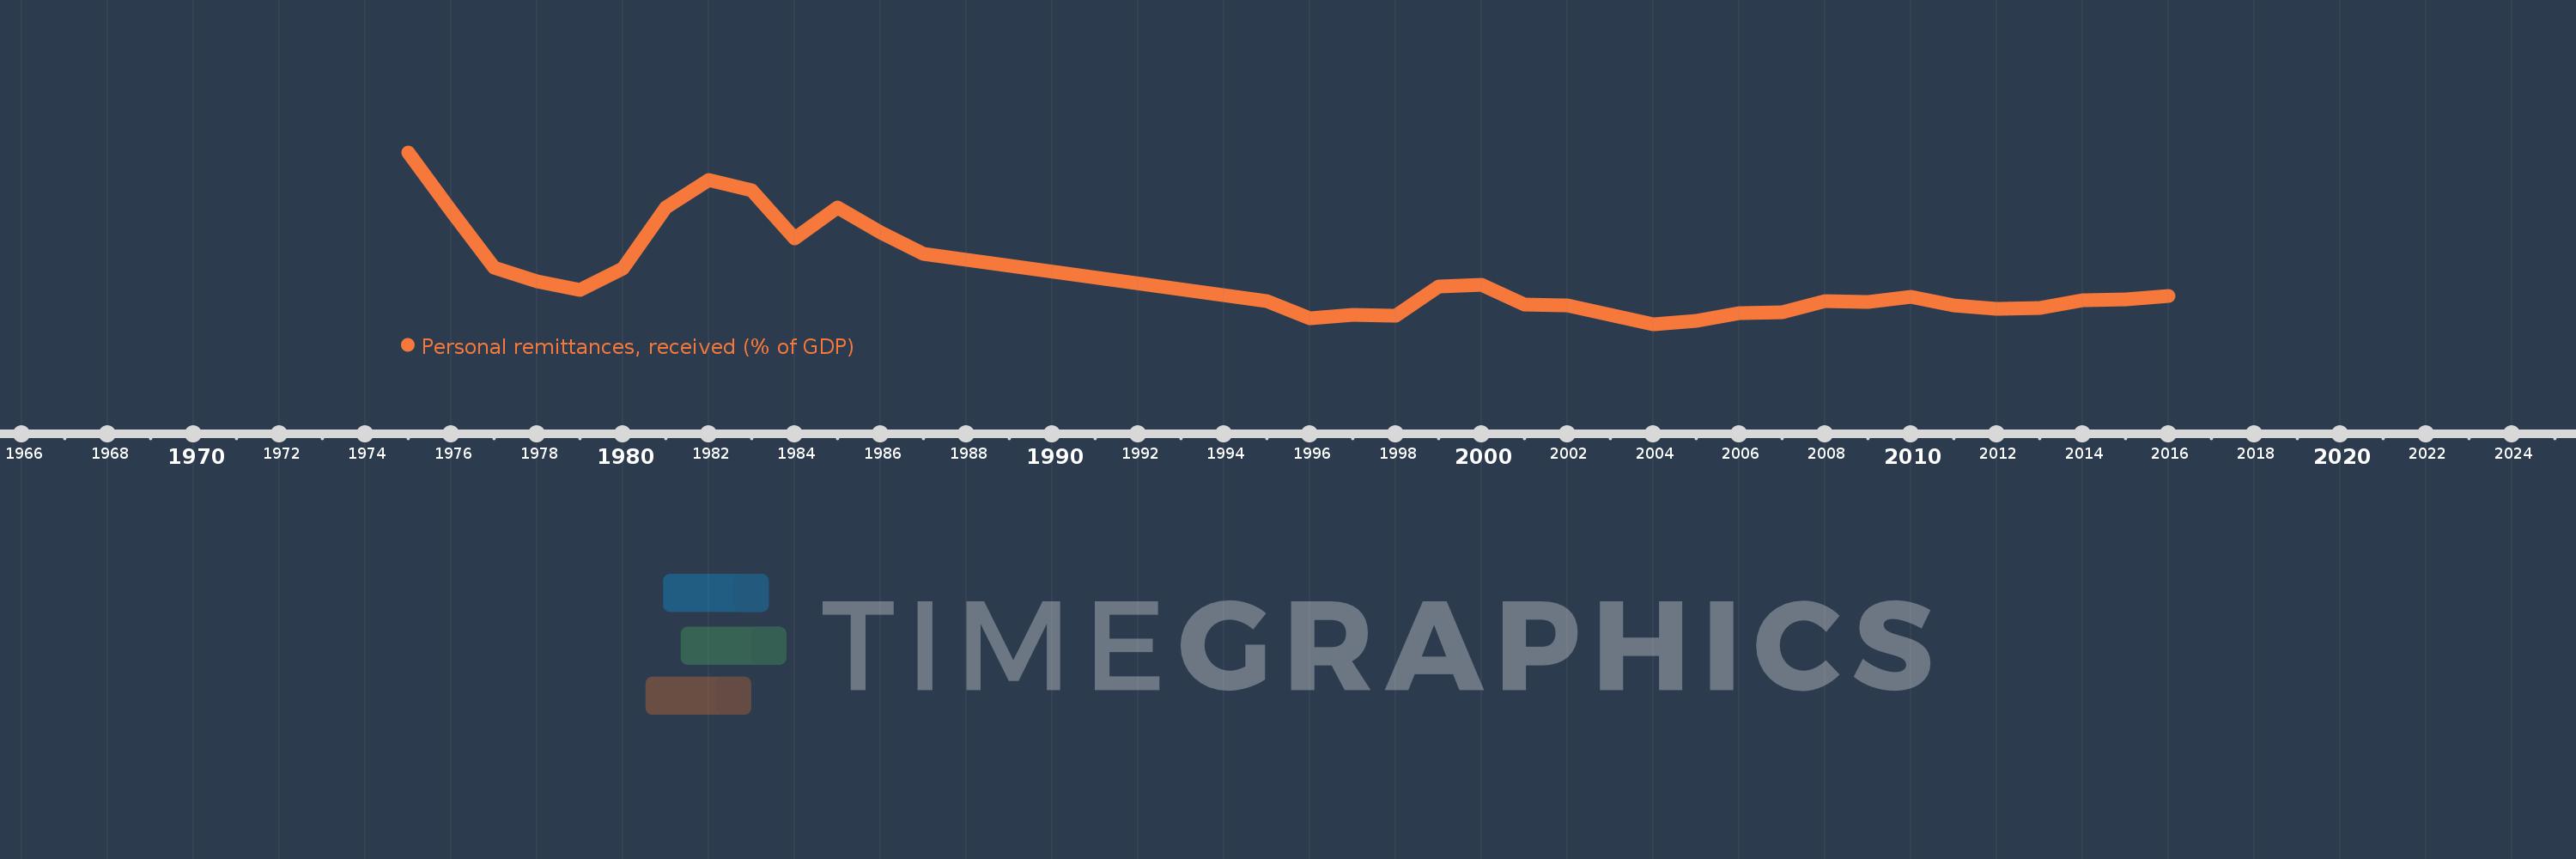
Personal remittances, received (% of GDP)
2016,2015,2014,2013,2012,2011,2010,2009,2008,2007,2006,2005,2004,2003,2002,2001,2000,1999,1998,1997,1996,1995,1987,1986,1985,1984,1983,1982,1981,1980,1979,1978,1977,1976,1975
This statistics in other country:
AfghanistanAlbaniaAlgeriaAngolaAntigua and BarbudaArab WorldArgentinaArmeniaArubaAustraliaAustriaAzerbaijanBangladeshBarbadosBelarusBelgiumBelizeBeninBermudaBhutanBoliviaBosnia and HerzegovinaBotswanaBrazilBulgariaBurkina FasoBurundiCabo VerdeCambodiaCameroonCanadaCaribbean small statesCentral African RepublicCentral Europe and the BalticsChadChileChinaColombiaComorosCongo, Dem. Rep.Congo, Rep.Costa RicaCote d'IvoireCroatiaCyprusCzech RepublicDenmarkDjiboutiDominicaDominican RepublicEarly-demographic dividendEast Asia & PacificEast Asia & Pacific (excluding high income)East Asia & Pacific (IDA & IBRD countries)EcuadorEgypt, Arab Rep.El SalvadorEquatorial GuineaEritreaEstoniaEthiopiaEuro areaEurope & Central AsiaEurope & Central Asia (excluding high income)Europe & Central Asia (IDA & IBRD countries)European UnionFaroe IslandsFijiFinlandFragile and conflict affected situationsFranceGabonGambia, TheGeorgiaGermanyGhanaGreeceGrenadaGuatemalaGuineaGuinea-BissauGuyanaHaitiHeavily indebted poor countries (HIPC)High incomeHondurasHong Kong SAR, ChinaHungaryIBRD onlyIcelandIDA & IBRD totalIDA blendIDA onlyIDA totalIndiaIndonesiaIran, Islamic Rep.IraqIrelandIsraelItalyJamaicaJapanJordanKazakhstanKenyaKiribatiKorea, Rep.KosovoKuwaitKyrgyz RepublicLao PDRLate-demographic dividendLatin America & Caribbean Latin America & Caribbean (excluding high income)Latin America & the Caribbean (IDA & IBRD countries)LatviaLeast developed countries: UN classificationLebanonLesothoLiberiaLibyaLithuaniaLow & middle incomeLow incomeLower middle incomeLuxembourgMacao SAR, ChinaMacedonia, FYRMadagascarMalawiMalaysiaMaldivesMaliMaltaMarshall IslandsMauritaniaMauritiusMexicoMicronesia, Fed. Sts.Middle East & North AfricaMiddle East & North Africa (excluding high income)Middle East & North Africa (IDA & IBRD countries)Middle incomeMoldovaMongoliaMontenegroMoroccoMozambiqueMyanmarNamibiaNepalNetherlandsNew ZealandNicaraguaNigerNigeriaNorth AmericaNorwayOECD membersOmanOther small statesPacific island small statesPakistanPalauPanamaPapua New GuineaParaguayPeruPhilippinesPolandPortugalPost-demographic dividendPre-demographic dividendQatarRomaniaRussian FederationRwandaSamoaSao Tome and PrincipeSaudi ArabiaSenegalSerbiaSeychellesSierra LeoneSlovak RepublicSloveniaSmall statesSolomon IslandsSouth AfricaSouth AsiaSouth Asia (IDA & IBRD)South SudanSpainSri LankaSt. Kitts and NevisSt. LuciaSt. Vincent and the GrenadinesSub-Saharan Africa Sub-Saharan Africa (excluding high income)Sub-Saharan Africa (IDA & IBRD countries)SudanSurinameSwazilandSwedenSwitzerlandSyrian Arab RepublicTajikistanTanzaniaThailandTimor-LesteTogoTongaTrinidad and TobagoTunisiaTurkeyTurkmenistanTuvaluUgandaUkraineUnited KingdomUnited StatesUpper middle incomeUruguayUzbekistanVanuatuVenezuela, RBVietnamWest Bank and GazaWorldYemen, Rep.ZambiaZimbabwe Timeline:
This timeline shows a graph from 1975 to 2016 of Europe & Central Asia (excluding high income). No data until 1974. Number of actual observations by date: 35.
Source name:
World Development Indicators
Source organization:
World Bank staff estimates based on IMF balance of payments data, and World Bank and OECD GDP estimates.
Categories, topics:
Economy & Growth, Financial Sector
Last updated:
apr 23, 2017
Indicators value changes by year
At the date of observation
Value
Absolute change
Change from previous value
jan 1, 1975
4.006
+4.006
0.0%
jan 1, 1976
2.939
-1.066
-26.62%
jan 1, 1977
1.915
-1.025
-34.85%
jan 1, 1978
1.674
-0.241
-12.61%
jan 1, 1979
1.509
-0.165
-9.84%
jan 1, 1980
1.895
+0.386
25.59%
jan 1, 1981
3.011
+1.116
58.87%
jan 1, 1982
3.505
+0.494
16.42%
jan 1, 1983
3.315
-0.19
-5.41%
jan 1, 1984
2.453
-0.862
-26.01%
jan 1, 1985
3.012
+0.559
22.79%
jan 1, 1986
2.549
-0.463
-15.37%
jan 1, 1987
2.158
-0.392
-15.36%
jan 1, 1995
1.307
-0.85
-39.41%
jan 1, 1996
1.001
-0.306
-23.43%
jan 1, 1997
1.059
+0.058
5.8%
jan 1, 1998
1.046
-0.013
-1.21%
jan 1, 1999
1.574
+0.528
50.47%
jan 1, 2000
1.602
+0.027
1.74%
jan 1, 2001
1.25
-0.351
-21.94%
jan 1, 2002
1.226
-0.025
-1.98%
jan 1, 2003
1.063
-0.162
-13.24%
jan 1, 2004
0.889
-0.174
-16.37%
jan 1, 2005
0.955
+0.065
7.37%
jan 1, 2006
1.096
+0.141
14.77%
jan 1, 2007
1.111
+0.016
1.42%
jan 1, 2008
1.311
+0.199
17.93%
jan 1, 2009
1.285
-0.026
-1.96%
jan 1, 2010
1.393
+0.108
8.38%
jan 1, 2011
1.223
-0.169
-12.15%
jan 1, 2012
1.167
-0.056
-4.59%
jan 1, 2013
1.186
+0.019
1.64%
jan 1, 2014
1.329
+0.143
12.02%
jan 1, 2015
1.338
+0.009
0.68%
jan 1, 2016
1.398
+0.06
4.51%
Ranking of countries by current statistics by years


Comments: