29
/
en
AIzaSyAYiBZKx7MnpbEhh9jyipgxe19OcubqV5w
April 1, 2024
164130
Japan
JPN
true
2
1
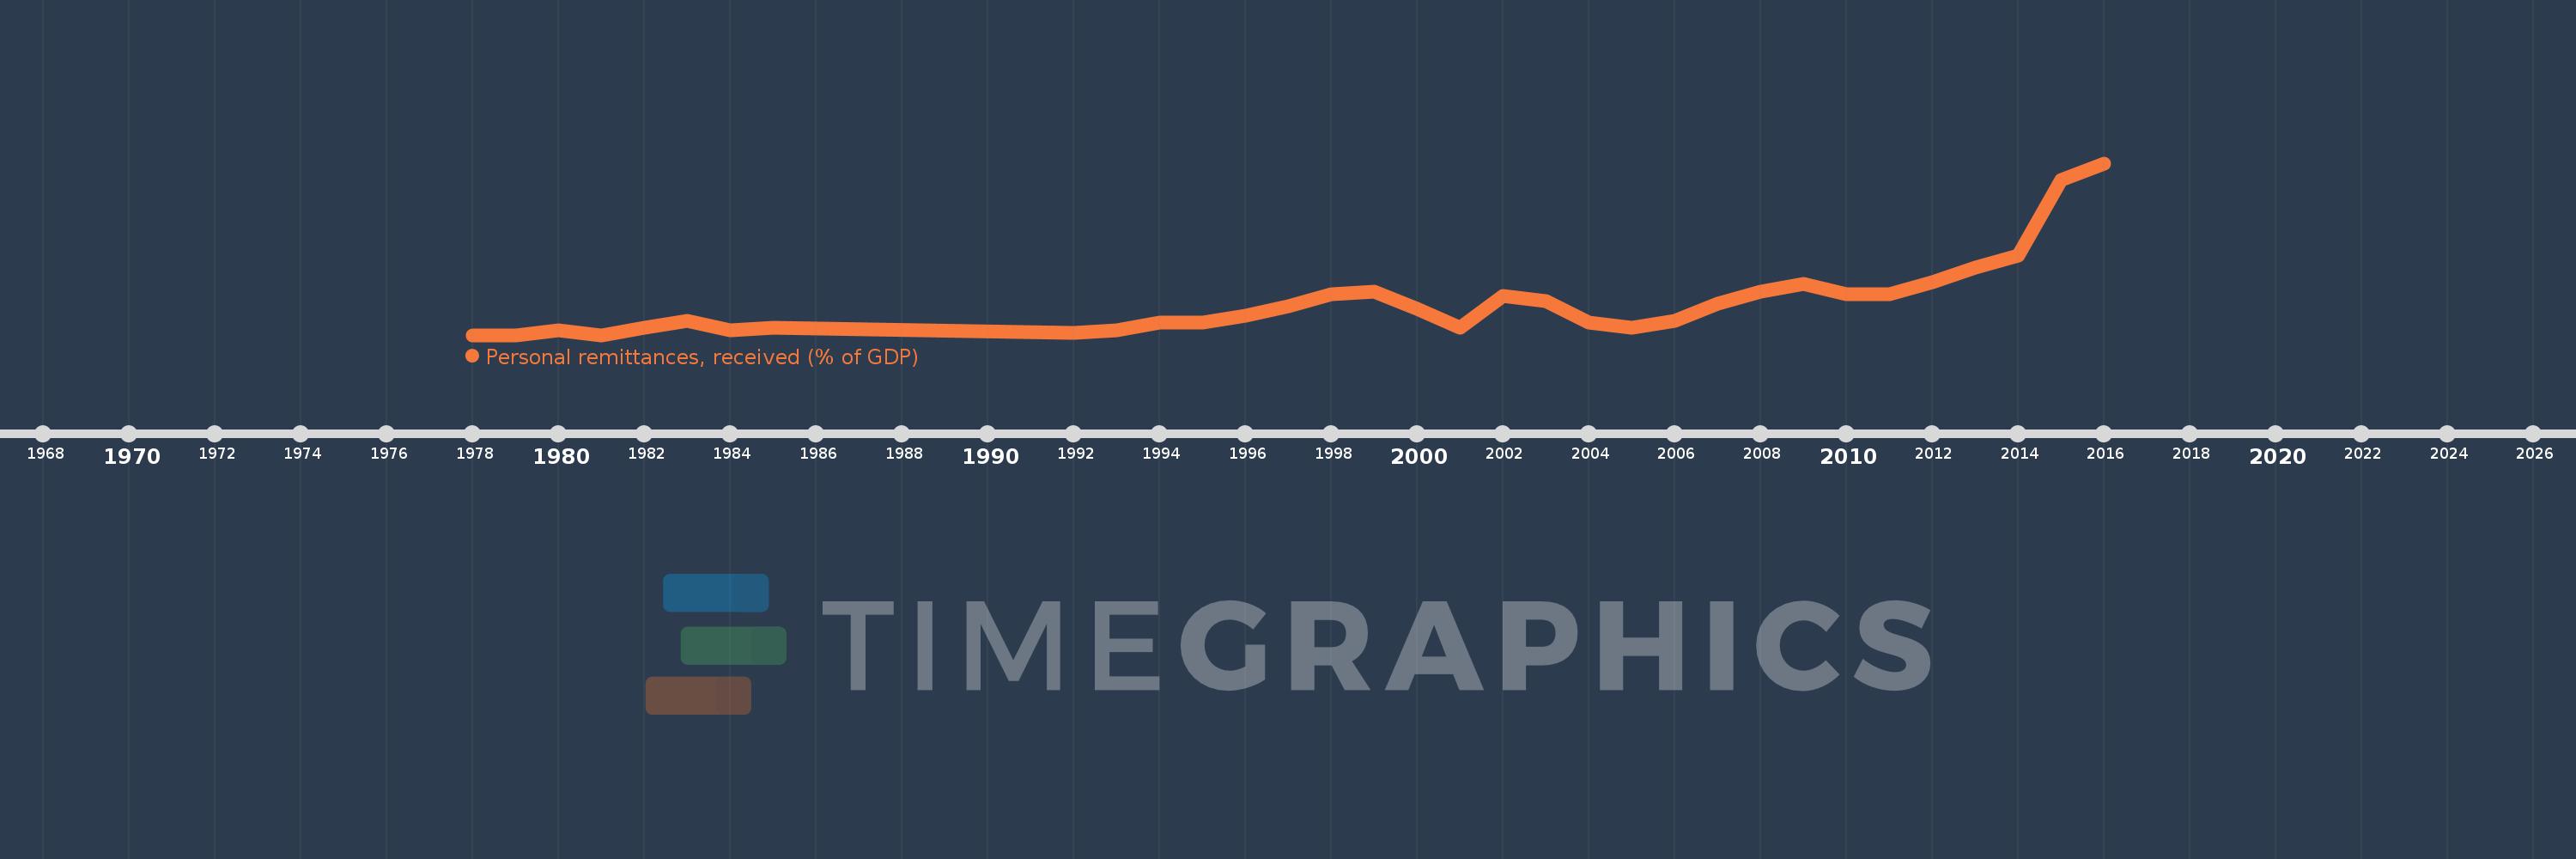
Personal remittances, received (% of GDP)
2016,2015,2014,2013,2012,2011,2010,2009,2008,2007,2006,2005,2004,2003,2002,2001,2000,1999,1998,1997,1996,1995,1994,1993,1992,1985,1984,1983,1982,1981,1980,1979,1978
This statistics in other country:
AfghanistanAlbaniaAlgeriaAngolaAntigua and BarbudaArab WorldArgentinaArmeniaArubaAustraliaAustriaAzerbaijanBangladeshBarbadosBelarusBelgiumBelizeBeninBermudaBhutanBoliviaBosnia and HerzegovinaBotswanaBrazilBulgariaBurkina FasoBurundiCabo VerdeCambodiaCameroonCanadaCaribbean small statesCentral African RepublicCentral Europe and the BalticsChadChileChinaColombiaComorosCongo, Dem. Rep.Congo, Rep.Costa RicaCote d'IvoireCroatiaCyprusCzech RepublicDenmarkDjiboutiDominicaDominican RepublicEarly-demographic dividendEast Asia & PacificEast Asia & Pacific (excluding high income)East Asia & Pacific (IDA & IBRD countries)EcuadorEgypt, Arab Rep.El SalvadorEquatorial GuineaEritreaEstoniaEthiopiaEuro areaEurope & Central AsiaEurope & Central Asia (excluding high income)Europe & Central Asia (IDA & IBRD countries)European UnionFaroe IslandsFijiFinlandFragile and conflict affected situationsFranceGabonGambia, TheGeorgiaGermanyGhanaGreeceGrenadaGuatemalaGuineaGuinea-BissauGuyanaHaitiHeavily indebted poor countries (HIPC)High incomeHondurasHong Kong SAR, ChinaHungaryIBRD onlyIcelandIDA & IBRD totalIDA blendIDA onlyIDA totalIndiaIndonesiaIran, Islamic Rep.IraqIrelandIsraelItalyJamaicaJapanJordanKazakhstanKenyaKiribatiKorea, Rep.KosovoKuwaitKyrgyz RepublicLao PDRLate-demographic dividendLatin America & Caribbean Latin America & Caribbean (excluding high income)Latin America & the Caribbean (IDA & IBRD countries)LatviaLeast developed countries: UN classificationLebanonLesothoLiberiaLibyaLithuaniaLow & middle incomeLow incomeLower middle incomeLuxembourgMacao SAR, ChinaMacedonia, FYRMadagascarMalawiMalaysiaMaldivesMaliMaltaMarshall IslandsMauritaniaMauritiusMexicoMicronesia, Fed. Sts.Middle East & North AfricaMiddle East & North Africa (excluding high income)Middle East & North Africa (IDA & IBRD countries)Middle incomeMoldovaMongoliaMontenegroMoroccoMozambiqueMyanmarNamibiaNepalNetherlandsNew ZealandNicaraguaNigerNigeriaNorth AmericaNorwayOECD membersOmanOther small statesPacific island small statesPakistanPalauPanamaPapua New GuineaParaguayPeruPhilippinesPolandPortugalPost-demographic dividendPre-demographic dividendQatarRomaniaRussian FederationRwandaSamoaSao Tome and PrincipeSaudi ArabiaSenegalSerbiaSeychellesSierra LeoneSlovak RepublicSloveniaSmall statesSolomon IslandsSouth AfricaSouth AsiaSouth Asia (IDA & IBRD)South SudanSpainSri LankaSt. Kitts and NevisSt. LuciaSt. Vincent and the GrenadinesSub-Saharan Africa Sub-Saharan Africa (excluding high income)Sub-Saharan Africa (IDA & IBRD countries)SudanSurinameSwazilandSwedenSwitzerlandSyrian Arab RepublicTajikistanTanzaniaThailandTimor-LesteTogoTongaTrinidad and TobagoTunisiaTurkeyTurkmenistanTuvaluUgandaUkraineUnited KingdomUnited StatesUpper middle incomeUruguayUzbekistanVanuatuVenezuela, RBVietnamWest Bank and GazaWorldYemen, Rep.ZambiaZimbabwe Timeline:
This timeline shows a graph from 1978 to 2016 of Japan. No data until 1977. Number of actual observations by date: 33.
Source name:
World Development Indicators
Source organization:
World Bank staff estimates based on IMF balance of payments data, and World Bank and OECD GDP estimates.
Categories, topics:
Economy & Growth, Financial Sector
Last updated:
apr 23, 2017
Indicators value changes by year
At the date of observation
Value
Absolute change
Change from previous value
jan 1, 1978
0.013
+0.013
0.0%
jan 1, 1979
0.013
+0.0
2.8%
jan 1, 1980
0.015
+0.002
18.25%
jan 1, 1981
0.013
-0.003
-16.49%
jan 1, 1982
0.016
+0.003
22.78%
jan 1, 1983
0.019
+0.003
18.9%
jan 1, 1984
0.015
-0.004
-21.41%
jan 1, 1985
0.016
+0.001
9.77%
jan 1, 1992
0.014
-0.002
-11.43%
jan 1, 1993
0.015
+0.001
5.15%
jan 1, 1994
0.018
+0.002
16.44%
jan 1, 1995
0.018
+0.0
1.28%
jan 1, 1996
0.021
+0.003
18.57%
jan 1, 1997
0.025
+0.004
20.25%
jan 1, 1998
0.03
+0.005
19.98%
jan 1, 1999
0.031
+0.0
0.82%
jan 1, 2000
0.024
-0.006
-20.87%
jan 1, 2001
0.016
-0.008
-34.91%
jan 1, 2002
0.029
+0.013
83.49%
jan 1, 2003
0.027
-0.002
-5.69%
jan 1, 2004
0.018
-0.009
-33.37%
jan 1, 2005
0.016
-0.002
-11.95%
jan 1, 2006
0.019
+0.003
18.46%
jan 1, 2007
0.026
+0.007
36.52%
jan 1, 2008
0.031
+0.005
17.98%
jan 1, 2009
0.034
+0.004
12.19%
jan 1, 2010
0.03
-0.004
-11.36%
jan 1, 2011
0.03
-0.001
-3.05%
jan 1, 2012
0.035
+0.005
17.15%
jan 1, 2013
0.041
+0.006
18.25%
jan 1, 2014
0.046
+0.005
11.99%
jan 1, 2015
0.077
+0.031
67.96%
jan 1, 2016
0.084
+0.007
8.74%
Ranking of countries by current statistics by years


Comments: