29
/
en
AIzaSyAYiBZKx7MnpbEhh9jyipgxe19OcubqV5w
April 1, 2024
178089
Lesotho
LSO
true
2
1
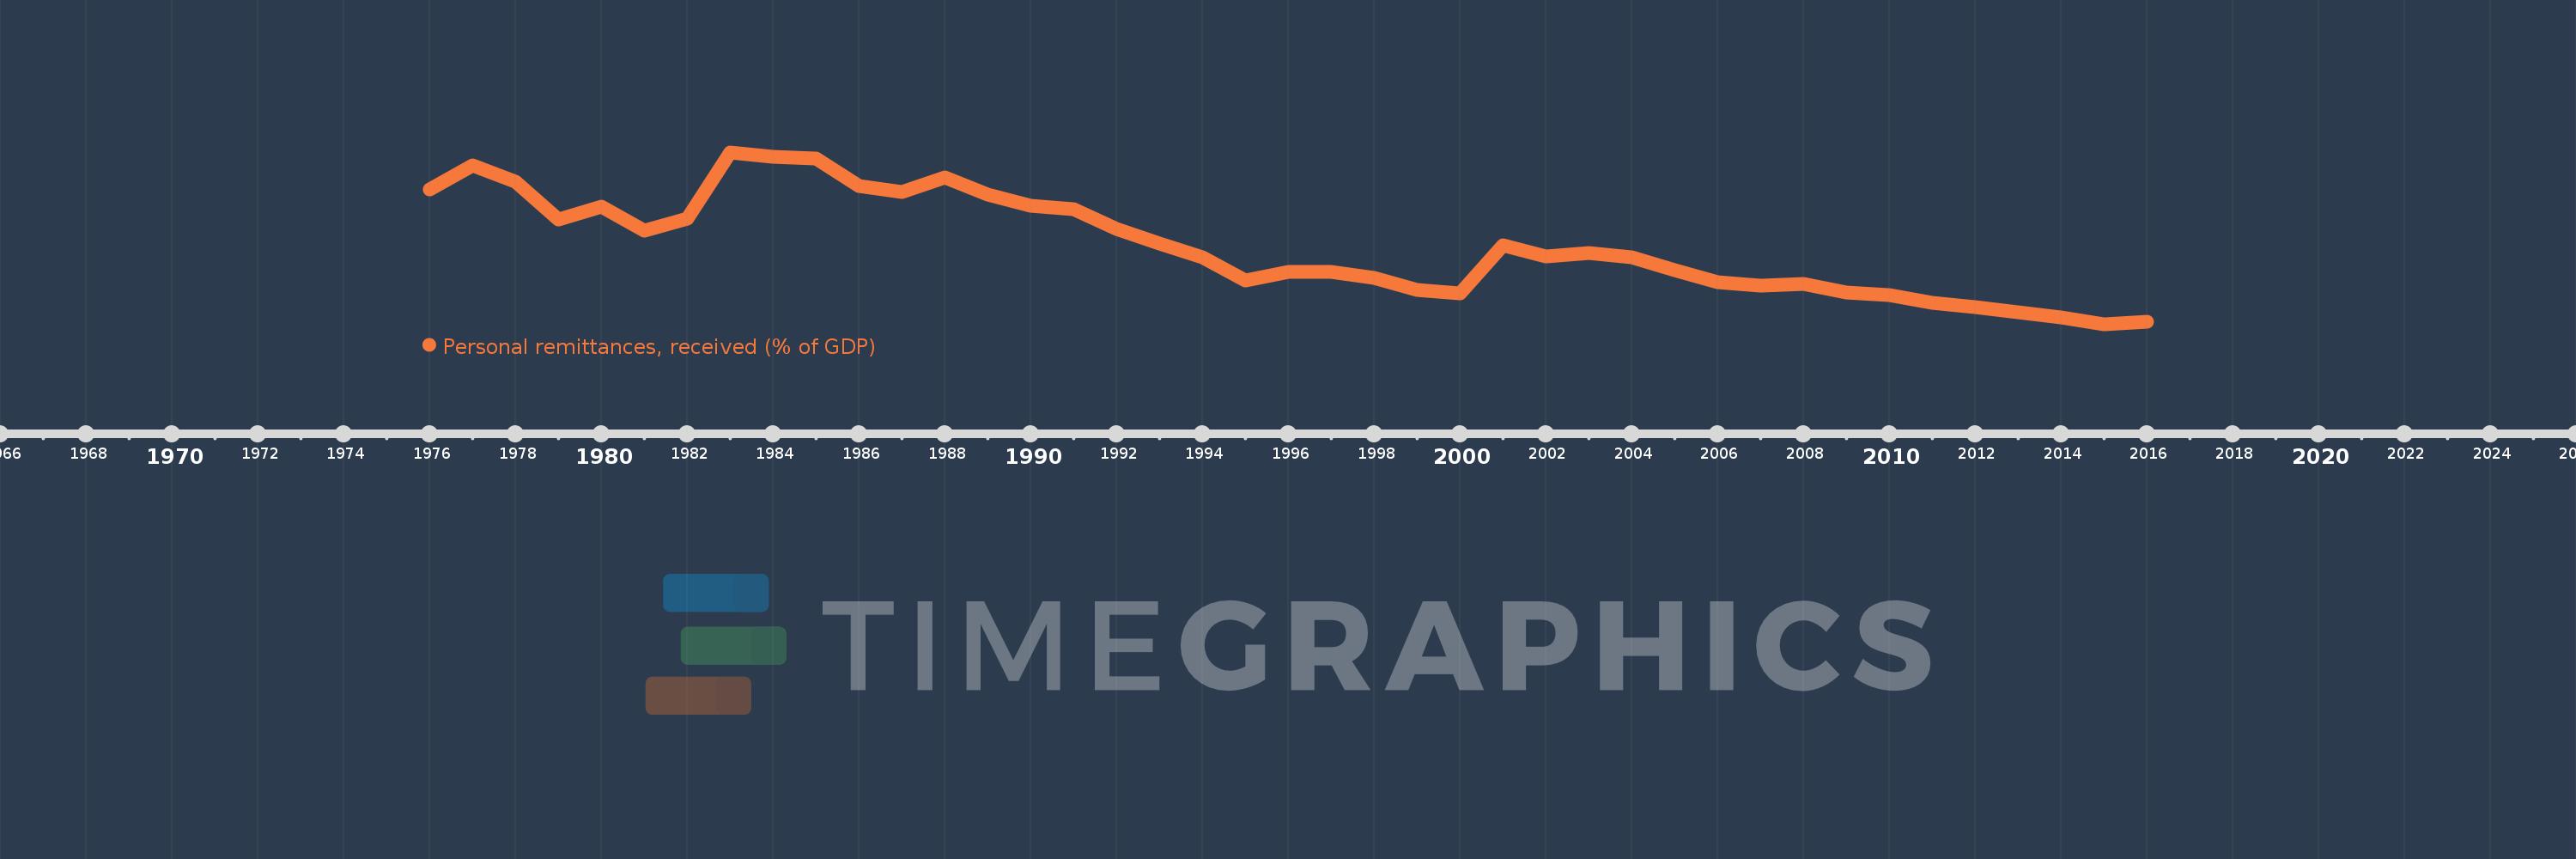
Personal remittances, received (% of GDP)
2016,2015,2014,2013,2012,2011,2010,2009,2008,2007,2006,2005,2004,2003,2002,2001,2000,1999,1998,1997,1996,1995,1994,1993,1992,1991,1990,1989,1988,1987,1986,1985,1984,1983,1982,1981,1980,1979,1978,1977,1976
This statistics in other country:
AfghanistanAlbaniaAlgeriaAngolaAntigua and BarbudaArab WorldArgentinaArmeniaArubaAustraliaAustriaAzerbaijanBangladeshBarbadosBelarusBelgiumBelizeBeninBermudaBhutanBoliviaBosnia and HerzegovinaBotswanaBrazilBulgariaBurkina FasoBurundiCabo VerdeCambodiaCameroonCanadaCaribbean small statesCentral African RepublicCentral Europe and the BalticsChadChileChinaColombiaComorosCongo, Dem. Rep.Congo, Rep.Costa RicaCote d'IvoireCroatiaCyprusCzech RepublicDenmarkDjiboutiDominicaDominican RepublicEarly-demographic dividendEast Asia & PacificEast Asia & Pacific (excluding high income)East Asia & Pacific (IDA & IBRD countries)EcuadorEgypt, Arab Rep.El SalvadorEquatorial GuineaEritreaEstoniaEthiopiaEuro areaEurope & Central AsiaEurope & Central Asia (excluding high income)Europe & Central Asia (IDA & IBRD countries)European UnionFaroe IslandsFijiFinlandFragile and conflict affected situationsFranceGabonGambia, TheGeorgiaGermanyGhanaGreeceGrenadaGuatemalaGuineaGuinea-BissauGuyanaHaitiHeavily indebted poor countries (HIPC)High incomeHondurasHong Kong SAR, ChinaHungaryIBRD onlyIcelandIDA & IBRD totalIDA blendIDA onlyIDA totalIndiaIndonesiaIran, Islamic Rep.IraqIrelandIsraelItalyJamaicaJapanJordanKazakhstanKenyaKiribatiKorea, Rep.KosovoKuwaitKyrgyz RepublicLao PDRLate-demographic dividendLatin America & Caribbean Latin America & Caribbean (excluding high income)Latin America & the Caribbean (IDA & IBRD countries)LatviaLeast developed countries: UN classificationLebanonLesothoLiberiaLibyaLithuaniaLow & middle incomeLow incomeLower middle incomeLuxembourgMacao SAR, ChinaMacedonia, FYRMadagascarMalawiMalaysiaMaldivesMaliMaltaMarshall IslandsMauritaniaMauritiusMexicoMicronesia, Fed. Sts.Middle East & North AfricaMiddle East & North Africa (excluding high income)Middle East & North Africa (IDA & IBRD countries)Middle incomeMoldovaMongoliaMontenegroMoroccoMozambiqueMyanmarNamibiaNepalNetherlandsNew ZealandNicaraguaNigerNigeriaNorth AmericaNorwayOECD membersOmanOther small statesPacific island small statesPakistanPalauPanamaPapua New GuineaParaguayPeruPhilippinesPolandPortugalPost-demographic dividendPre-demographic dividendQatarRomaniaRussian FederationRwandaSamoaSao Tome and PrincipeSaudi ArabiaSenegalSerbiaSeychellesSierra LeoneSlovak RepublicSloveniaSmall statesSolomon IslandsSouth AfricaSouth AsiaSouth Asia (IDA & IBRD)South SudanSpainSri LankaSt. Kitts and NevisSt. LuciaSt. Vincent and the GrenadinesSub-Saharan Africa Sub-Saharan Africa (excluding high income)Sub-Saharan Africa (IDA & IBRD countries)SudanSurinameSwazilandSwedenSwitzerlandSyrian Arab RepublicTajikistanTanzaniaThailandTimor-LesteTogoTongaTrinidad and TobagoTunisiaTurkeyTurkmenistanTuvaluUgandaUkraineUnited KingdomUnited StatesUpper middle incomeUruguayUzbekistanVanuatuVenezuela, RBVietnamWest Bank and GazaWorldYemen, Rep.ZambiaZimbabwe Timeline:
This timeline shows a graph from 1976 to 2016 of Lesotho. No data until 1975. Number of actual observations by date: 41.
Source name:
World Development Indicators
Source organization:
World Bank staff estimates based on IMF balance of payments data, and World Bank and OECD GDP estimates.
Categories, topics:
Economy & Growth, Financial Sector
Last updated:
apr 23, 2017
Indicators value changes by year
Minimum:
14.975
jan 1, 2015
Maximum:
99.822
jan 1, 1983
At the date of observation
Value
Absolute change
Change from previous value
jan 1, 1976
81.373
+81.373
0.0%
jan 1, 1977
93.462
+12.088
14.86%
jan 1, 1978
85.429
-8.033
-8.59%
jan 1, 1979
66.569
-18.86
-22.08%
jan 1, 1980
73.228
+6.659
10.0%
jan 1, 1981
60.991
-12.237
-16.71%
jan 1, 1982
66.927
+5.936
9.73%
jan 1, 1983
99.822
+32.895
49.15%
jan 1, 1984
97.72
-2.102
-2.11%
jan 1, 1985
96.818
-0.903
-0.92%
jan 1, 1986
83.356
-13.461
-13.9%
jan 1, 1987
80.113
-3.244
-3.89%
jan 1, 1988
87.664
+7.551
9.43%
jan 1, 1989
78.968
-8.695
-9.92%
jan 1, 1990
73.669
-5.3
-6.71%
jan 1, 1991
71.742
-1.927
-2.62%
jan 1, 1992
62.056
-9.686
-13.5%
jan 1, 1993
54.803
-7.253
-11.69%
jan 1, 1994
47.961
-6.842
-12.49%
jan 1, 1995
36.396
-11.564
-24.11%
jan 1, 1996
40.976
+4.579
12.58%
jan 1, 1997
40.973
-0.003
-0.01%
jan 1, 1998
37.951
-3.022
-7.38%
jan 1, 1999
31.734
-6.217
-16.38%
jan 1, 2000
30.231
-1.503
-4.74%
jan 1, 2001
53.826
+23.595
78.05%
jan 1, 2002
48.596
-5.23
-9.72%
jan 1, 2003
50.102
+1.506
3.1%
jan 1, 2004
48.096
-2.006
-4.0%
jan 1, 2005
41.5
-6.596
-13.71%
jan 1, 2006
35.626
-5.874
-14.15%
jan 1, 2007
34.102
-1.524
-4.28%
jan 1, 2008
34.96
+0.858
2.52%
jan 1, 2009
30.698
-4.262
-12.19%
jan 1, 2010
29.301
-1.397
-4.55%
jan 1, 2011
25.505
-3.795
-12.95%
jan 1, 2012
23.226
-2.279
-8.94%
jan 1, 2013
20.799
-2.427
-10.45%
jan 1, 2014
18.521
-2.278
-10.95%
jan 1, 2015
14.975
-3.546
-19.14%
jan 1, 2016
16.048
+1.073
7.16%
Ranking of countries by current statistics by years


Comments: