29
/
en
AIzaSyAYiBZKx7MnpbEhh9jyipgxe19OcubqV5w
April 1, 2024
209667
New Zealand
NZL
true
2
1
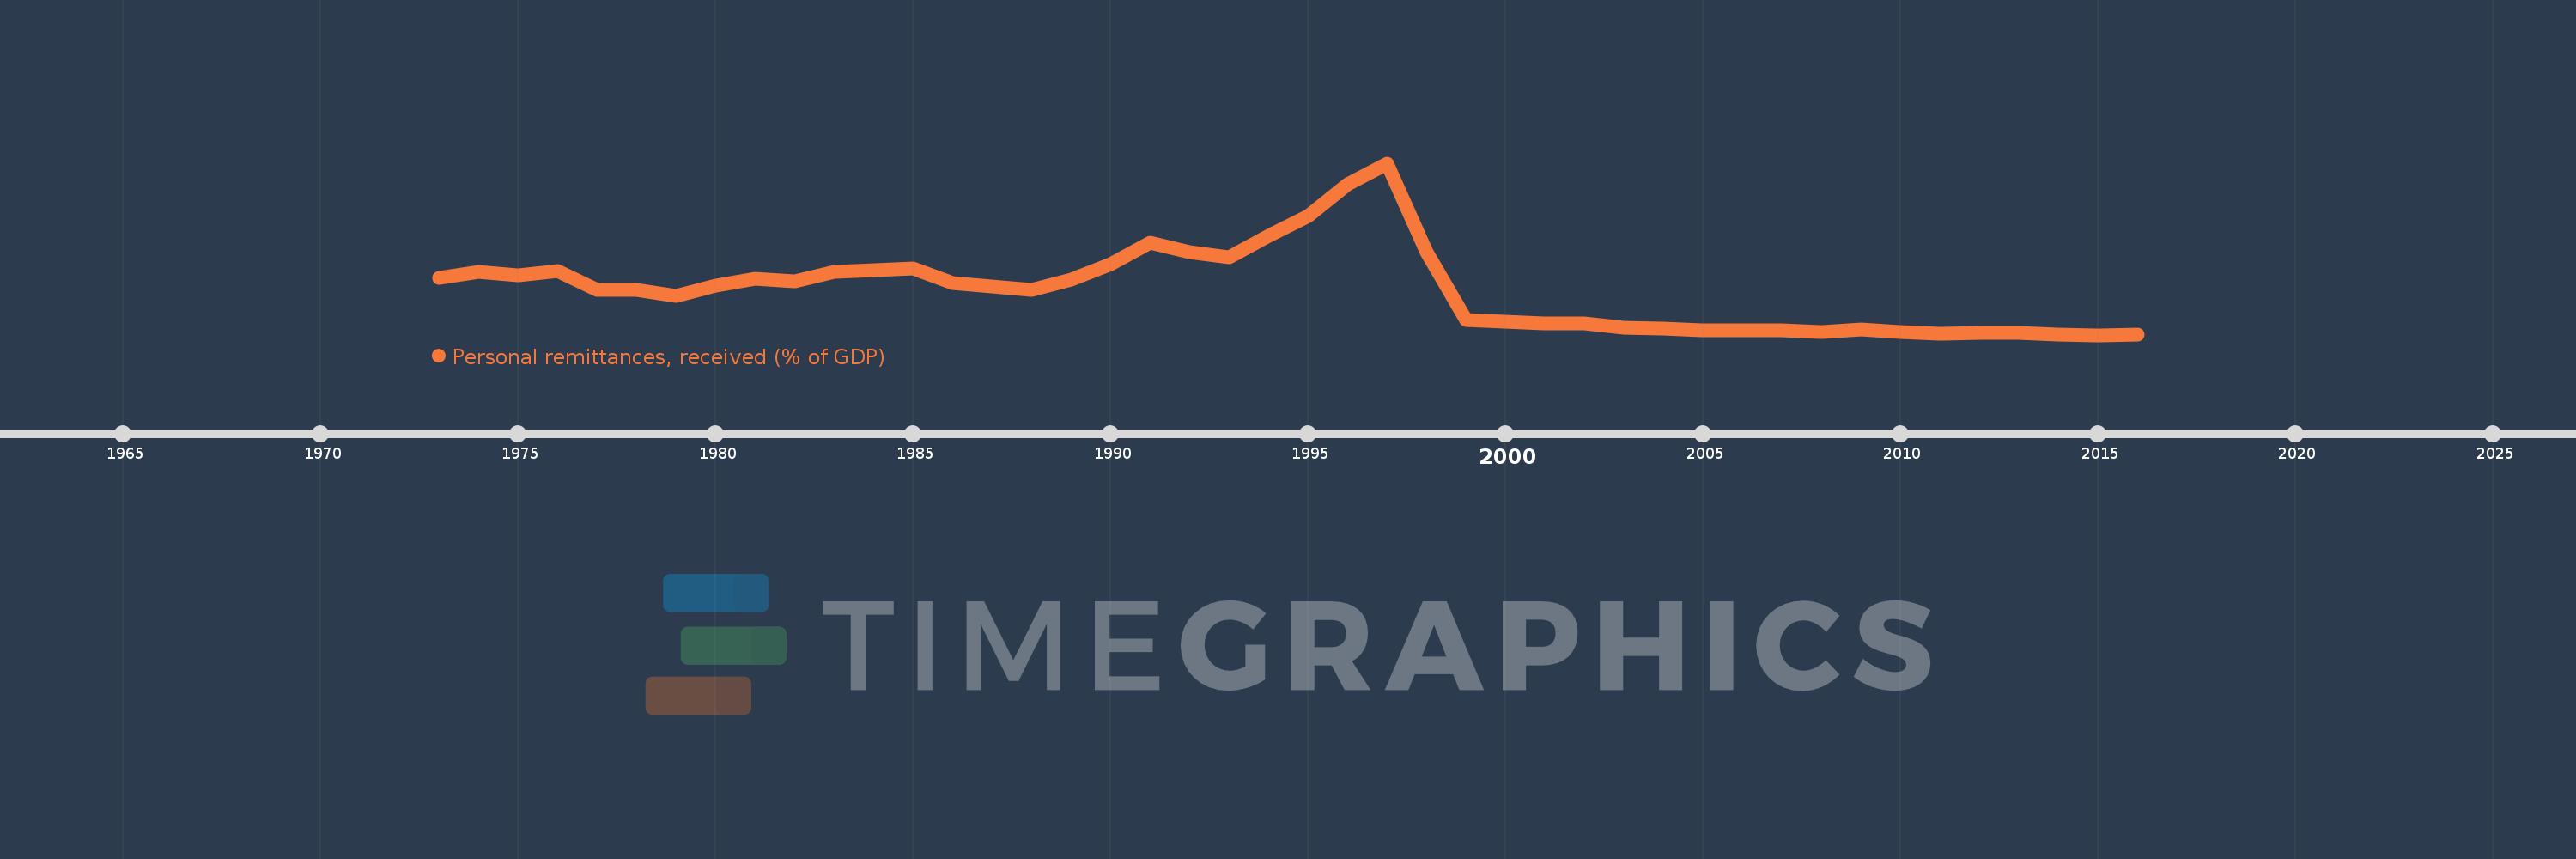
Personal remittances, received (% of GDP)
2016,2015,2014,2013,2012,2011,2010,2009,2008,2007,2006,2005,2004,2003,2002,2001,2000,1999,1998,1997,1996,1995,1994,1993,1992,1991,1990,1989,1988,1987,1986,1985,1984,1983,1982,1981,1980,1979,1978,1977,1976,1975,1974,1973
This statistics in other country:
AfghanistanAlbaniaAlgeriaAngolaAntigua and BarbudaArab WorldArgentinaArmeniaArubaAustraliaAustriaAzerbaijanBangladeshBarbadosBelarusBelgiumBelizeBeninBermudaBhutanBoliviaBosnia and HerzegovinaBotswanaBrazilBulgariaBurkina FasoBurundiCabo VerdeCambodiaCameroonCanadaCaribbean small statesCentral African RepublicCentral Europe and the BalticsChadChileChinaColombiaComorosCongo, Dem. Rep.Congo, Rep.Costa RicaCote d'IvoireCroatiaCyprusCzech RepublicDenmarkDjiboutiDominicaDominican RepublicEarly-demographic dividendEast Asia & PacificEast Asia & Pacific (excluding high income)East Asia & Pacific (IDA & IBRD countries)EcuadorEgypt, Arab Rep.El SalvadorEquatorial GuineaEritreaEstoniaEthiopiaEuro areaEurope & Central AsiaEurope & Central Asia (excluding high income)Europe & Central Asia (IDA & IBRD countries)European UnionFaroe IslandsFijiFinlandFragile and conflict affected situationsFranceGabonGambia, TheGeorgiaGermanyGhanaGreeceGrenadaGuatemalaGuineaGuinea-BissauGuyanaHaitiHeavily indebted poor countries (HIPC)High incomeHondurasHong Kong SAR, ChinaHungaryIBRD onlyIcelandIDA & IBRD totalIDA blendIDA onlyIDA totalIndiaIndonesiaIran, Islamic Rep.IraqIrelandIsraelItalyJamaicaJapanJordanKazakhstanKenyaKiribatiKorea, Rep.KosovoKuwaitKyrgyz RepublicLao PDRLate-demographic dividendLatin America & Caribbean Latin America & Caribbean (excluding high income)Latin America & the Caribbean (IDA & IBRD countries)LatviaLeast developed countries: UN classificationLebanonLesothoLiberiaLibyaLithuaniaLow & middle incomeLow incomeLower middle incomeLuxembourgMacao SAR, ChinaMacedonia, FYRMadagascarMalawiMalaysiaMaldivesMaliMaltaMarshall IslandsMauritaniaMauritiusMexicoMicronesia, Fed. Sts.Middle East & North AfricaMiddle East & North Africa (excluding high income)Middle East & North Africa (IDA & IBRD countries)Middle incomeMoldovaMongoliaMontenegroMoroccoMozambiqueMyanmarNamibiaNepalNetherlandsNew ZealandNicaraguaNigerNigeriaNorth AmericaNorwayOECD membersOmanOther small statesPacific island small statesPakistanPalauPanamaPapua New GuineaParaguayPeruPhilippinesPolandPortugalPost-demographic dividendPre-demographic dividendQatarRomaniaRussian FederationRwandaSamoaSao Tome and PrincipeSaudi ArabiaSenegalSerbiaSeychellesSierra LeoneSlovak RepublicSloveniaSmall statesSolomon IslandsSouth AfricaSouth AsiaSouth Asia (IDA & IBRD)South SudanSpainSri LankaSt. Kitts and NevisSt. LuciaSt. Vincent and the GrenadinesSub-Saharan Africa Sub-Saharan Africa (excluding high income)Sub-Saharan Africa (IDA & IBRD countries)SudanSurinameSwazilandSwedenSwitzerlandSyrian Arab RepublicTajikistanTanzaniaThailandTimor-LesteTogoTongaTrinidad and TobagoTunisiaTurkeyTurkmenistanTuvaluUgandaUkraineUnited KingdomUnited StatesUpper middle incomeUruguayUzbekistanVanuatuVenezuela, RBVietnamWest Bank and GazaWorldYemen, Rep.ZambiaZimbabwe Timeline:
This timeline shows a graph from 1973 to 2016 of New Zealand. No data until 1972. Number of actual observations by date: 44.
Source name:
World Development Indicators
Source organization:
World Bank staff estimates based on IMF balance of payments data, and World Bank and OECD GDP estimates.
Categories, topics:
Economy & Growth, Financial Sector
Last updated:
apr 23, 2017
Indicators value changes by year
At the date of observation
Value
Absolute change
Change from previous value
jan 1, 1973
1.124
+1.124
0.0%
jan 1, 1974
1.219
+0.095
8.43%
jan 1, 1975
1.163
-0.056
-4.59%
jan 1, 1976
1.224
+0.061
5.2%
jan 1, 1977
0.936
-0.287
-23.49%
jan 1, 1978
0.93
-0.006
-0.67%
jan 1, 1979
0.839
-0.091
-9.74%
jan 1, 1980
1.001
+0.161
19.23%
jan 1, 1981
1.102
+0.101
10.11%
jan 1, 1982
1.063
-0.038
-3.49%
jan 1, 1983
1.219
+0.156
14.63%
jan 1, 1984
1.237
+0.018
1.49%
jan 1, 1985
1.271
+0.033
2.7%
jan 1, 1986
1.039
-0.232
-18.26%
jan 1, 1987
0.992
-0.046
-4.48%
jan 1, 1988
0.939
-0.053
-5.32%
jan 1, 1989
1.089
+0.15
15.93%
jan 1, 1990
1.332
+0.243
22.31%
jan 1, 1991
1.675
+0.343
25.73%
jan 1, 1992
1.523
-0.151
-9.03%
jan 1, 1993
1.446
-0.077
-5.05%
jan 1, 1994
1.781
+0.334
23.12%
jan 1, 1995
2.088
+0.307
17.23%
jan 1, 1996
2.584
+0.496
23.78%
jan 1, 1997
2.908
+0.324
12.55%
jan 1, 1998
1.529
-1.379
-47.42%
jan 1, 1999
0.461
-1.068
-69.82%
jan 1, 2000
0.438
-0.023
-5.02%
jan 1, 2001
0.409
-0.029
-6.65%
jan 1, 2002
0.406
-0.003
-0.73%
jan 1, 2003
0.349
-0.057
-14.07%
jan 1, 2004
0.329
-0.02
-5.7%
jan 1, 2005
0.31
-0.019
-5.75%
jan 1, 2006
0.307
-0.003
-1.06%
jan 1, 2007
0.3
-0.007
-2.28%
jan 1, 2008
0.279
-0.02
-6.83%
jan 1, 2009
0.316
+0.037
13.15%
jan 1, 2010
0.273
-0.043
-13.7%
jan 1, 2011
0.253
-0.02
-7.36%
jan 1, 2012
0.27
+0.018
6.93%
jan 1, 2013
0.261
-0.009
-3.26%
jan 1, 2014
0.241
-0.021
-7.89%
jan 1, 2015
0.231
-0.01
-4.09%
jan 1, 2016
0.242
+0.011
4.79%
Ranking of countries by current statistics by years


Comments: