29
/
en
AIzaSyAYiBZKx7MnpbEhh9jyipgxe19OcubqV5w
April 1, 2024
196039
Mexico
MEX
true
2
1
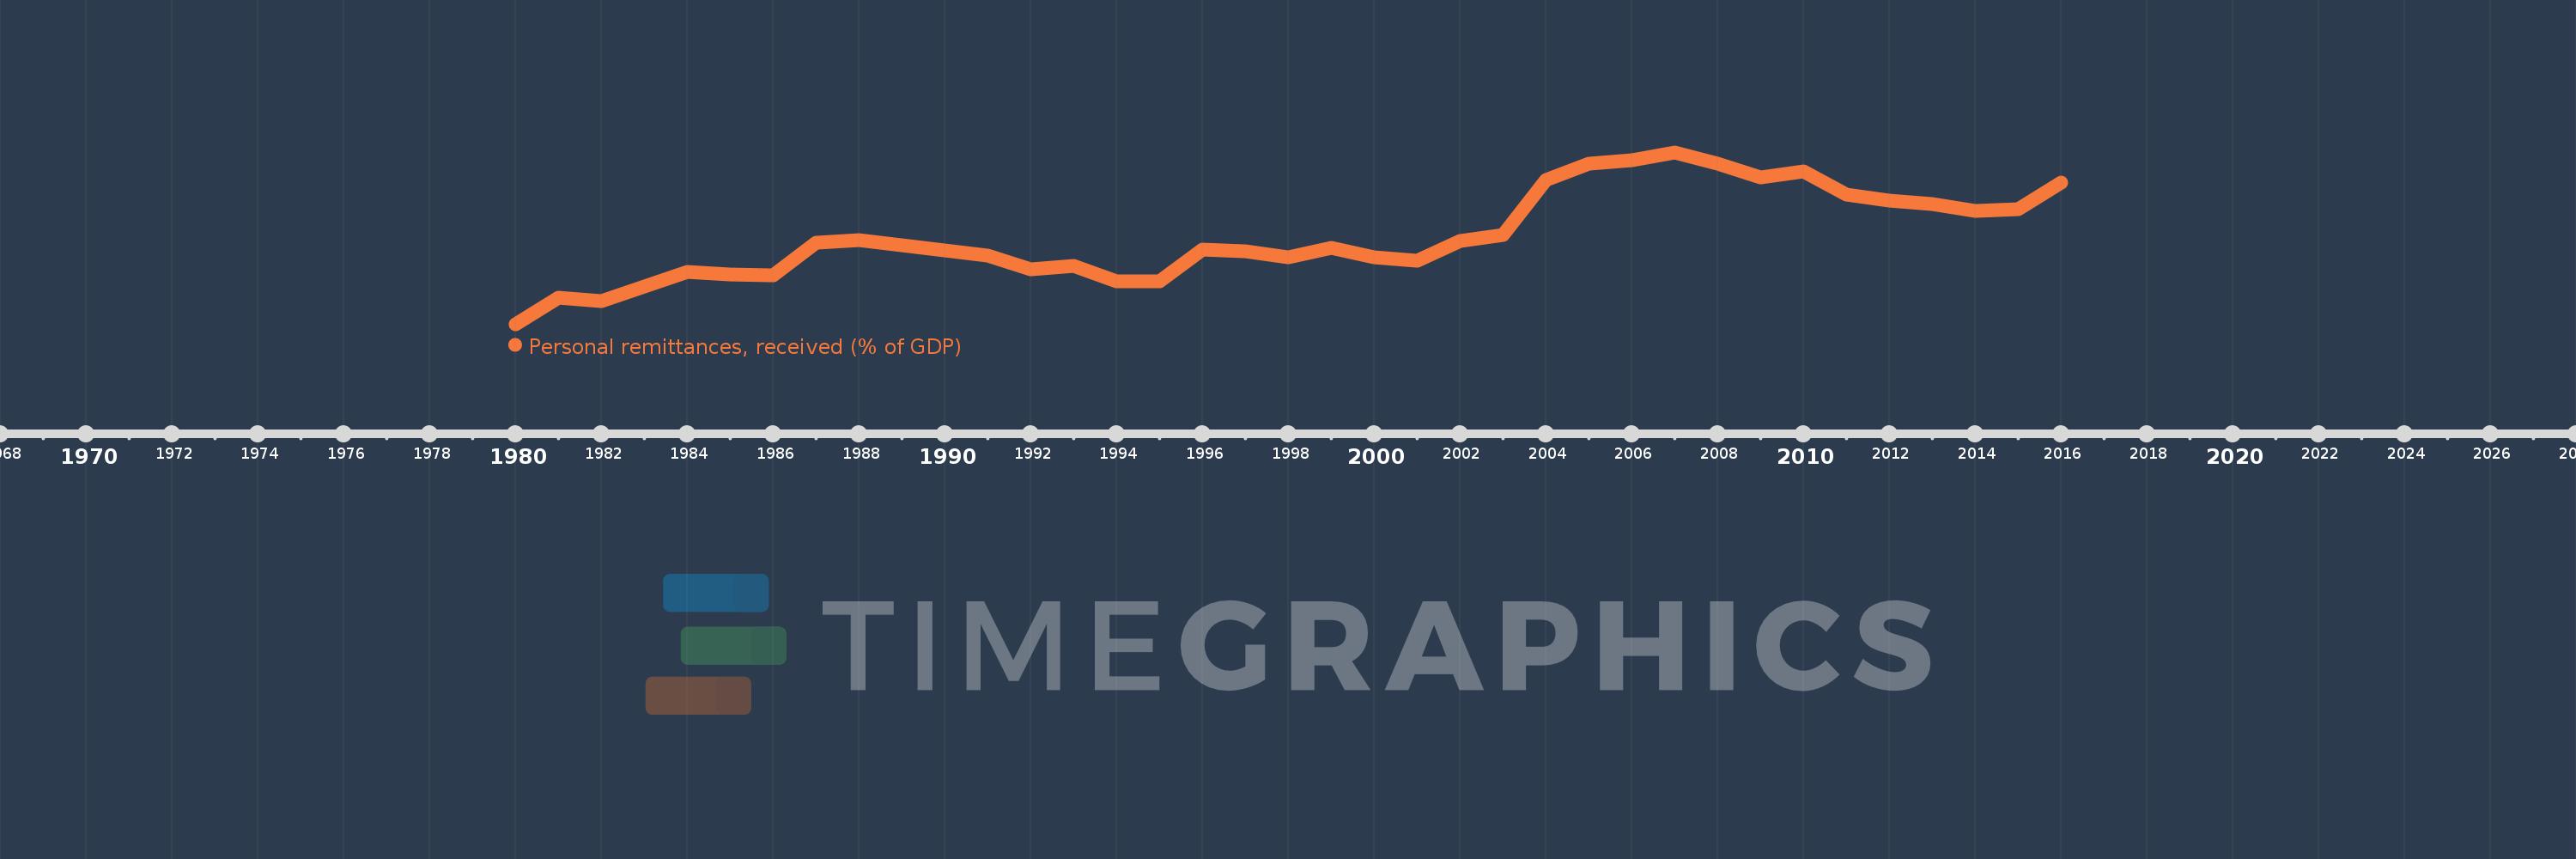
Personal remittances, received (% of GDP)
2016,2015,2014,2013,2012,2011,2010,2009,2008,2007,2006,2005,2004,2003,2002,2001,2000,1999,1998,1997,1996,1995,1994,1993,1992,1991,1990,1989,1988,1987,1986,1985,1984,1983,1982,1981,1980
This statistics in other country:
AfghanistanAlbaniaAlgeriaAngolaAntigua and BarbudaArab WorldArgentinaArmeniaArubaAustraliaAustriaAzerbaijanBangladeshBarbadosBelarusBelgiumBelizeBeninBermudaBhutanBoliviaBosnia and HerzegovinaBotswanaBrazilBulgariaBurkina FasoBurundiCabo VerdeCambodiaCameroonCanadaCaribbean small statesCentral African RepublicCentral Europe and the BalticsChadChileChinaColombiaComorosCongo, Dem. Rep.Congo, Rep.Costa RicaCote d'IvoireCroatiaCyprusCzech RepublicDenmarkDjiboutiDominicaDominican RepublicEarly-demographic dividendEast Asia & PacificEast Asia & Pacific (excluding high income)East Asia & Pacific (IDA & IBRD countries)EcuadorEgypt, Arab Rep.El SalvadorEquatorial GuineaEritreaEstoniaEthiopiaEuro areaEurope & Central AsiaEurope & Central Asia (excluding high income)Europe & Central Asia (IDA & IBRD countries)European UnionFaroe IslandsFijiFinlandFragile and conflict affected situationsFranceGabonGambia, TheGeorgiaGermanyGhanaGreeceGrenadaGuatemalaGuineaGuinea-BissauGuyanaHaitiHeavily indebted poor countries (HIPC)High incomeHondurasHong Kong SAR, ChinaHungaryIBRD onlyIcelandIDA & IBRD totalIDA blendIDA onlyIDA totalIndiaIndonesiaIran, Islamic Rep.IraqIrelandIsraelItalyJamaicaJapanJordanKazakhstanKenyaKiribatiKorea, Rep.KosovoKuwaitKyrgyz RepublicLao PDRLate-demographic dividendLatin America & Caribbean Latin America & Caribbean (excluding high income)Latin America & the Caribbean (IDA & IBRD countries)LatviaLeast developed countries: UN classificationLebanonLesothoLiberiaLibyaLithuaniaLow & middle incomeLow incomeLower middle incomeLuxembourgMacao SAR, ChinaMacedonia, FYRMadagascarMalawiMalaysiaMaldivesMaliMaltaMarshall IslandsMauritaniaMauritiusMexicoMicronesia, Fed. Sts.Middle East & North AfricaMiddle East & North Africa (excluding high income)Middle East & North Africa (IDA & IBRD countries)Middle incomeMoldovaMongoliaMontenegroMoroccoMozambiqueMyanmarNamibiaNepalNetherlandsNew ZealandNicaraguaNigerNigeriaNorth AmericaNorwayOECD membersOmanOther small statesPacific island small statesPakistanPalauPanamaPapua New GuineaParaguayPeruPhilippinesPolandPortugalPost-demographic dividendPre-demographic dividendQatarRomaniaRussian FederationRwandaSamoaSao Tome and PrincipeSaudi ArabiaSenegalSerbiaSeychellesSierra LeoneSlovak RepublicSloveniaSmall statesSolomon IslandsSouth AfricaSouth AsiaSouth Asia (IDA & IBRD)South SudanSpainSri LankaSt. Kitts and NevisSt. LuciaSt. Vincent and the GrenadinesSub-Saharan Africa Sub-Saharan Africa (excluding high income)Sub-Saharan Africa (IDA & IBRD countries)SudanSurinameSwazilandSwedenSwitzerlandSyrian Arab RepublicTajikistanTanzaniaThailandTimor-LesteTogoTongaTrinidad and TobagoTunisiaTurkeyTurkmenistanTuvaluUgandaUkraineUnited KingdomUnited StatesUpper middle incomeUruguayUzbekistanVanuatuVenezuela, RBVietnamWest Bank and GazaWorldYemen, Rep.ZambiaZimbabwe Timeline:
This timeline shows a graph from 1980 to 2016 of Mexico. No data until 1979. Number of actual observations by date: 37.
Source name:
World Development Indicators
Source organization:
World Bank staff estimates based on IMF balance of payments data, and World Bank and OECD GDP estimates.
Categories, topics:
Economy & Growth, Financial Sector
Last updated:
apr 23, 2017
Indicators value changes by year
At the date of observation
Value
Absolute change
Change from previous value
jan 1, 1980
0.132
+0.132
0.0%
jan 1, 1981
0.535
+0.403
306.35%
jan 1, 1982
0.488
-0.047
-8.74%
jan 1, 1983
0.706
+0.218
44.66%
jan 1, 1984
0.934
+0.229
32.4%
jan 1, 1985
0.889
-0.046
-4.88%
jan 1, 1986
0.876
-0.013
-1.44%
jan 1, 1987
1.368
+0.492
56.19%
jan 1, 1988
1.415
+0.047
3.43%
jan 1, 1989
1.332
-0.083
-5.9%
jan 1, 1990
1.253
-0.079
-5.94%
jan 1, 1991
1.179
-0.073
-5.86%
jan 1, 1992
0.964
-0.216
-18.29%
jan 1, 1993
1.018
+0.054
5.6%
jan 1, 1994
0.79
-0.228
-22.41%
jan 1, 1995
0.782
-0.008
-1.0%
jan 1, 1996
1.271
+0.489
62.55%
jan 1, 1997
1.245
-0.025
-1.99%
jan 1, 1998
1.154
-0.091
-7.33%
jan 1, 1999
1.295
+0.141
12.22%
jan 1, 2000
1.147
-0.148
-11.4%
jan 1, 2001
1.101
-0.047
-4.07%
jan 1, 2002
1.4
+0.299
27.2%
jan 1, 2003
1.487
+0.087
6.23%
jan 1, 2004
2.335
+0.847
56.98%
jan 1, 2005
2.579
+0.244
10.44%
jan 1, 2006
2.625
+0.046
1.8%
jan 1, 2007
2.75
+0.125
4.75%
jan 1, 2008
2.576
-0.174
-6.32%
jan 1, 2009
2.365
-0.211
-8.2%
jan 1, 2010
2.467
+0.102
4.32%
jan 1, 2011
2.101
-0.366
-14.84%
jan 1, 2012
2.014
-0.087
-4.12%
jan 1, 2013
1.969
-0.045
-2.23%
jan 1, 2014
1.857
-0.112
-5.7%
jan 1, 2015
1.884
+0.028
1.48%
jan 1, 2016
2.288
+0.403
21.39%
Ranking of countries by current statistics by years


Comments: