29
/
en
AIzaSyAYiBZKx7MnpbEhh9jyipgxe19OcubqV5w
April 1, 2024
265061
Togo
TGO
true
2
1
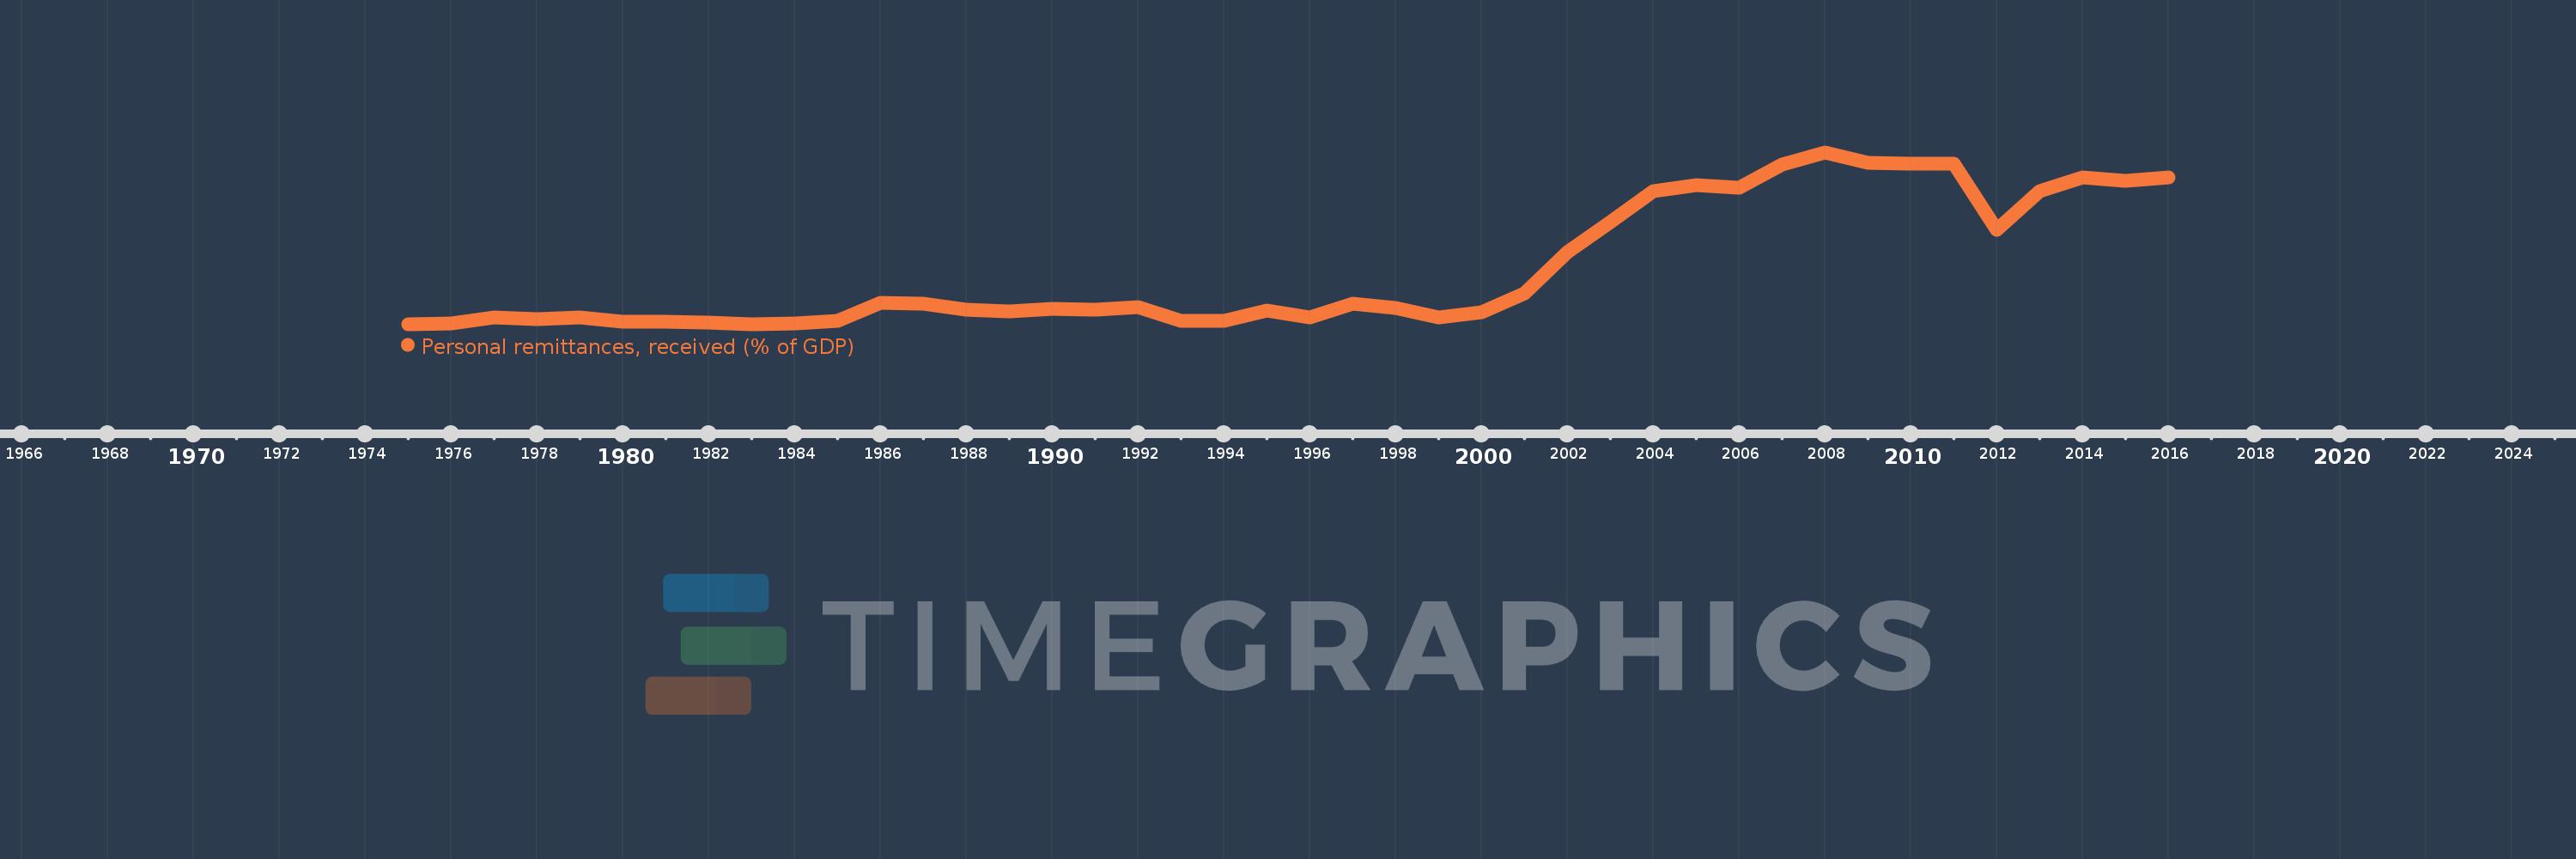
Personal remittances, received (% of GDP)
2016,2015,2014,2013,2012,2011,2010,2009,2008,2007,2006,2005,2004,2003,2002,2001,2000,1999,1998,1997,1996,1995,1994,1993,1992,1991,1990,1989,1988,1987,1986,1985,1984,1983,1982,1981,1980,1979,1978,1977,1976,1975
This statistics in other country:
AfghanistanAlbaniaAlgeriaAngolaAntigua and BarbudaArab WorldArgentinaArmeniaArubaAustraliaAustriaAzerbaijanBangladeshBarbadosBelarusBelgiumBelizeBeninBermudaBhutanBoliviaBosnia and HerzegovinaBotswanaBrazilBulgariaBurkina FasoBurundiCabo VerdeCambodiaCameroonCanadaCaribbean small statesCentral African RepublicCentral Europe and the BalticsChadChileChinaColombiaComorosCongo, Dem. Rep.Congo, Rep.Costa RicaCote d'IvoireCroatiaCyprusCzech RepublicDenmarkDjiboutiDominicaDominican RepublicEarly-demographic dividendEast Asia & PacificEast Asia & Pacific (excluding high income)East Asia & Pacific (IDA & IBRD countries)EcuadorEgypt, Arab Rep.El SalvadorEquatorial GuineaEritreaEstoniaEthiopiaEuro areaEurope & Central AsiaEurope & Central Asia (excluding high income)Europe & Central Asia (IDA & IBRD countries)European UnionFaroe IslandsFijiFinlandFragile and conflict affected situationsFranceGabonGambia, TheGeorgiaGermanyGhanaGreeceGrenadaGuatemalaGuineaGuinea-BissauGuyanaHaitiHeavily indebted poor countries (HIPC)High incomeHondurasHong Kong SAR, ChinaHungaryIBRD onlyIcelandIDA & IBRD totalIDA blendIDA onlyIDA totalIndiaIndonesiaIran, Islamic Rep.IraqIrelandIsraelItalyJamaicaJapanJordanKazakhstanKenyaKiribatiKorea, Rep.KosovoKuwaitKyrgyz RepublicLao PDRLate-demographic dividendLatin America & Caribbean Latin America & Caribbean (excluding high income)Latin America & the Caribbean (IDA & IBRD countries)LatviaLeast developed countries: UN classificationLebanonLesothoLiberiaLibyaLithuaniaLow & middle incomeLow incomeLower middle incomeLuxembourgMacao SAR, ChinaMacedonia, FYRMadagascarMalawiMalaysiaMaldivesMaliMaltaMarshall IslandsMauritaniaMauritiusMexicoMicronesia, Fed. Sts.Middle East & North AfricaMiddle East & North Africa (excluding high income)Middle East & North Africa (IDA & IBRD countries)Middle incomeMoldovaMongoliaMontenegroMoroccoMozambiqueMyanmarNamibiaNepalNetherlandsNew ZealandNicaraguaNigerNigeriaNorth AmericaNorwayOECD membersOmanOther small statesPacific island small statesPakistanPalauPanamaPapua New GuineaParaguayPeruPhilippinesPolandPortugalPost-demographic dividendPre-demographic dividendQatarRomaniaRussian FederationRwandaSamoaSao Tome and PrincipeSaudi ArabiaSenegalSerbiaSeychellesSierra LeoneSlovak RepublicSloveniaSmall statesSolomon IslandsSouth AfricaSouth AsiaSouth Asia (IDA & IBRD)South SudanSpainSri LankaSt. Kitts and NevisSt. LuciaSt. Vincent and the GrenadinesSub-Saharan Africa Sub-Saharan Africa (excluding high income)Sub-Saharan Africa (IDA & IBRD countries)SudanSurinameSwazilandSwedenSwitzerlandSyrian Arab RepublicTajikistanTanzaniaThailandTimor-LesteTogoTongaTrinidad and TobagoTunisiaTurkeyTurkmenistanTuvaluUgandaUkraineUnited KingdomUnited StatesUpper middle incomeUruguayUzbekistanVanuatuVenezuela, RBVietnamWest Bank and GazaWorldYemen, Rep.ZambiaZimbabwe Timeline:
This timeline shows a graph from 1975 to 2016 of Togo. No data until 1974. Number of actual observations by date: 42.
Source name:
World Development Indicators
Source organization:
World Bank staff estimates based on IMF balance of payments data, and World Bank and OECD GDP estimates.
Categories, topics:
Economy & Growth, Financial Sector
Last updated:
apr 23, 2017
Indicators value changes by year
Maximum:
11.272
jan 1, 2008
At the date of observation
Value
Absolute change
Change from previous value
jan 1, 1975
0.735
+0.735
0.0%
jan 1, 1976
0.772
+0.038
5.15%
jan 1, 1977
1.144
+0.371
48.08%
jan 1, 1978
1.032
-0.111
-9.74%
jan 1, 1979
1.132
+0.1
9.67%
jan 1, 1980
0.892
-0.24
-21.18%
jan 1, 1981
0.874
-0.018
-2.04%
jan 1, 1982
0.817
-0.057
-6.52%
jan 1, 1983
0.744
-0.073
-8.95%
jan 1, 1984
0.794
+0.05
6.67%
jan 1, 1985
0.92
+0.127
15.96%
jan 1, 1986
2.021
+1.1
119.57%
jan 1, 1987
2.019
-0.001
-0.07%
jan 1, 1988
1.605
-0.415
-20.53%
jan 1, 1989
1.54
-0.064
-4.01%
jan 1, 1990
1.69
+0.15
9.71%
jan 1, 1991
1.65
-0.04
-2.35%
jan 1, 1992
1.808
+0.158
9.56%
jan 1, 1993
0.96
-0.849
-46.93%
jan 1, 1994
0.95
-0.01
-1.0%
jan 1, 1995
1.558
+0.608
63.97%
jan 1, 1996
1.147
-0.41
-26.35%
jan 1, 1997
2.004
+0.857
74.7%
jan 1, 1998
1.752
-0.252
-12.59%
jan 1, 1999
1.17
-0.582
-33.22%
jan 1, 2000
1.451
+0.281
23.98%
jan 1, 2001
2.645
+1.195
82.35%
jan 1, 2002
5.142
+2.496
94.38%
jan 1, 2003
6.999
+1.858
36.13%
jan 1, 2004
8.884
+1.885
26.93%
jan 1, 2005
9.242
+0.358
4.03%
jan 1, 2006
9.101
-0.141
-1.52%
jan 1, 2007
10.54
+1.439
15.81%
jan 1, 2008
11.272
+0.733
6.95%
jan 1, 2009
10.655
-0.617
-5.48%
jan 1, 2010
10.576
-0.079
-0.74%
jan 1, 2011
10.608
+0.033
0.31%
jan 1, 2012
6.5
-4.109
-38.73%
jan 1, 2013
8.916
+2.417
37.18%
jan 1, 2014
9.737
+0.821
9.2%
jan 1, 2015
9.532
-0.205
-2.11%
jan 1, 2016
9.72
+0.189
1.98%
Ranking of countries by current statistics by years


Comments: