29
/
en
AIzaSyAYiBZKx7MnpbEhh9jyipgxe19OcubqV5w
April 1, 2024
39351
IDA only
IDX
false
2
1
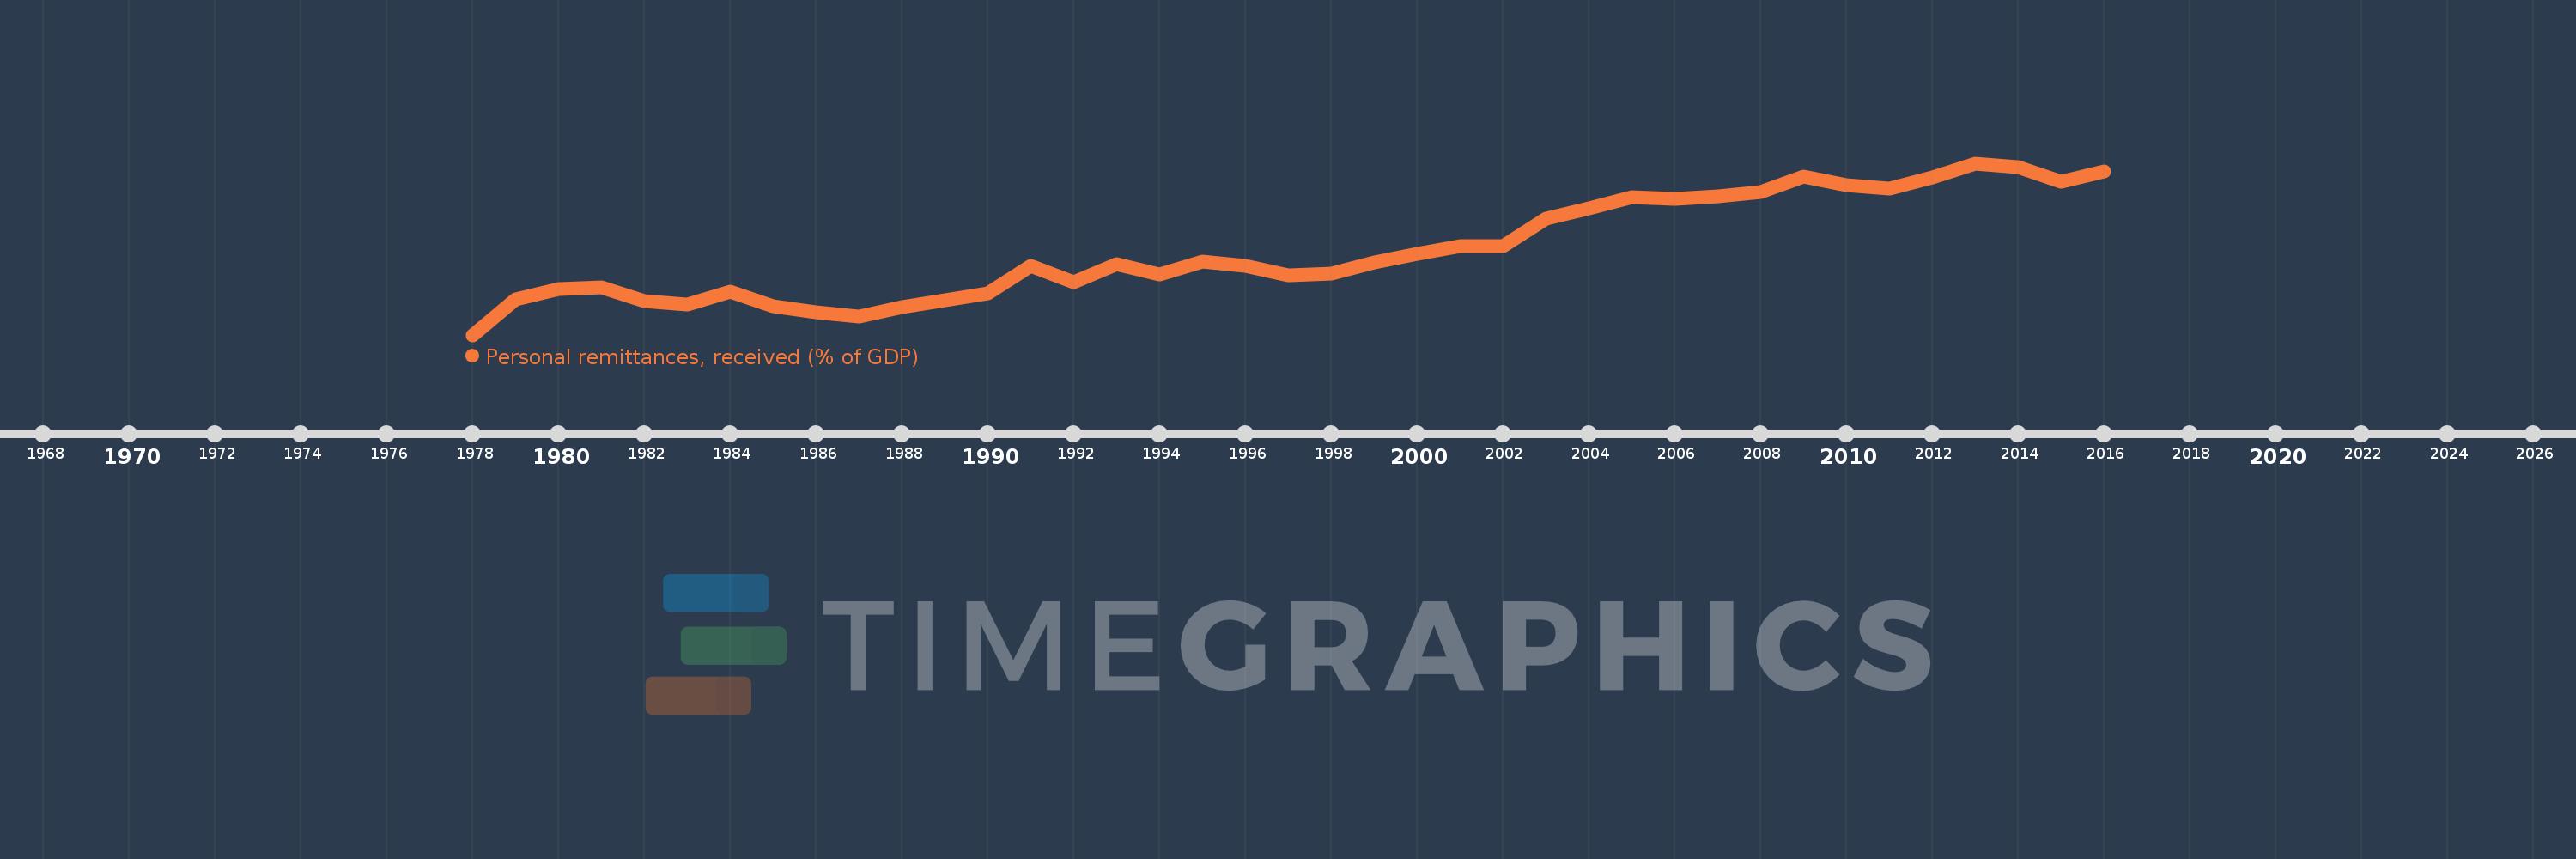
Personal remittances, received (% of GDP)
2016,2015,2014,2013,2012,2011,2010,2009,2008,2007,2006,2005,2004,2003,2002,2001,2000,1999,1998,1997,1996,1995,1994,1993,1992,1991,1990,1989,1988,1987,1986,1985,1984,1983,1982,1981,1980,1979,1978
This statistics in other country:
AfghanistanAlbaniaAlgeriaAngolaAntigua and BarbudaArab WorldArgentinaArmeniaArubaAustraliaAustriaAzerbaijanBangladeshBarbadosBelarusBelgiumBelizeBeninBermudaBhutanBoliviaBosnia and HerzegovinaBotswanaBrazilBulgariaBurkina FasoBurundiCabo VerdeCambodiaCameroonCanadaCaribbean small statesCentral African RepublicCentral Europe and the BalticsChadChileChinaColombiaComorosCongo, Dem. Rep.Congo, Rep.Costa RicaCote d'IvoireCroatiaCyprusCzech RepublicDenmarkDjiboutiDominicaDominican RepublicEarly-demographic dividendEast Asia & PacificEast Asia & Pacific (excluding high income)East Asia & Pacific (IDA & IBRD countries)EcuadorEgypt, Arab Rep.El SalvadorEquatorial GuineaEritreaEstoniaEthiopiaEuro areaEurope & Central AsiaEurope & Central Asia (excluding high income)Europe & Central Asia (IDA & IBRD countries)European UnionFaroe IslandsFijiFinlandFragile and conflict affected situationsFranceGabonGambia, TheGeorgiaGermanyGhanaGreeceGrenadaGuatemalaGuineaGuinea-BissauGuyanaHaitiHeavily indebted poor countries (HIPC)High incomeHondurasHong Kong SAR, ChinaHungaryIBRD onlyIcelandIDA & IBRD totalIDA blendIDA onlyIDA totalIndiaIndonesiaIran, Islamic Rep.IraqIrelandIsraelItalyJamaicaJapanJordanKazakhstanKenyaKiribatiKorea, Rep.KosovoKuwaitKyrgyz RepublicLao PDRLate-demographic dividendLatin America & Caribbean Latin America & Caribbean (excluding high income)Latin America & the Caribbean (IDA & IBRD countries)LatviaLeast developed countries: UN classificationLebanonLesothoLiberiaLibyaLithuaniaLow & middle incomeLow incomeLower middle incomeLuxembourgMacao SAR, ChinaMacedonia, FYRMadagascarMalawiMalaysiaMaldivesMaliMaltaMarshall IslandsMauritaniaMauritiusMexicoMicronesia, Fed. Sts.Middle East & North AfricaMiddle East & North Africa (excluding high income)Middle East & North Africa (IDA & IBRD countries)Middle incomeMoldovaMongoliaMontenegroMoroccoMozambiqueMyanmarNamibiaNepalNetherlandsNew ZealandNicaraguaNigerNigeriaNorth AmericaNorwayOECD membersOmanOther small statesPacific island small statesPakistanPalauPanamaPapua New GuineaParaguayPeruPhilippinesPolandPortugalPost-demographic dividendPre-demographic dividendQatarRomaniaRussian FederationRwandaSamoaSao Tome and PrincipeSaudi ArabiaSenegalSerbiaSeychellesSierra LeoneSlovak RepublicSloveniaSmall statesSolomon IslandsSouth AfricaSouth AsiaSouth Asia (IDA & IBRD)South SudanSpainSri LankaSt. Kitts and NevisSt. LuciaSt. Vincent and the GrenadinesSub-Saharan Africa Sub-Saharan Africa (excluding high income)Sub-Saharan Africa (IDA & IBRD countries)SudanSurinameSwazilandSwedenSwitzerlandSyrian Arab RepublicTajikistanTanzaniaThailandTimor-LesteTogoTongaTrinidad and TobagoTunisiaTurkeyTurkmenistanTuvaluUgandaUkraineUnited KingdomUnited StatesUpper middle incomeUruguayUzbekistanVanuatuVenezuela, RBVietnamWest Bank and GazaWorldYemen, Rep.ZambiaZimbabwe Timeline:
This timeline shows a graph from 1978 to 2016 of IDA only. No data until 1977. Number of actual observations by date: 39.
Source name:
World Development Indicators
Source organization:
World Bank staff estimates based on IMF balance of payments data, and World Bank and OECD GDP estimates.
Categories, topics:
Economy & Growth, Financial Sector
Last updated:
apr 23, 2017
Indicators value changes by year
At the date of observation
Value
Absolute change
Change from previous value
jan 1, 1978
1.162
+1.162
0.0%
jan 1, 1979
2.136
+0.974
83.87%
jan 1, 1980
2.414
+0.278
13.03%
jan 1, 1981
2.462
+0.048
1.99%
jan 1, 1982
2.082
-0.381
-15.46%
jan 1, 1983
1.995
-0.087
-4.16%
jan 1, 1984
2.328
+0.333
16.68%
jan 1, 1985
1.94
-0.388
-16.67%
jan 1, 1986
1.783
-0.156
-8.07%
jan 1, 1987
1.671
-0.113
-6.32%
jan 1, 1988
1.912
+0.241
14.43%
jan 1, 1989
2.104
+0.193
10.08%
jan 1, 1990
2.289
+0.184
8.77%
jan 1, 1991
3.044
+0.755
33.0%
jan 1, 1992
2.6
-0.444
-14.59%
jan 1, 1993
3.082
+0.482
18.53%
jan 1, 1994
2.804
-0.278
-9.03%
jan 1, 1995
3.149
+0.345
12.3%
jan 1, 1996
3.033
-0.116
-3.68%
jan 1, 1997
2.77
-0.263
-8.66%
jan 1, 1998
2.829
+0.059
2.13%
jan 1, 1999
3.139
+0.31
10.94%
jan 1, 2000
3.371
+0.232
7.39%
jan 1, 2001
3.574
+0.203
6.02%
jan 1, 2002
3.583
+0.01
0.27%
jan 1, 2003
4.313
+0.73
20.38%
jan 1, 2004
4.6
+0.286
6.64%
jan 1, 2005
4.904
+0.304
6.61%
jan 1, 2006
4.863
-0.041
-0.84%
jan 1, 2007
4.927
+0.064
1.32%
jan 1, 2008
5.045
+0.118
2.39%
jan 1, 2009
5.449
+0.404
8.01%
jan 1, 2010
5.217
-0.232
-4.26%
jan 1, 2011
5.125
-0.092
-1.77%
jan 1, 2012
5.428
+0.304
5.93%
jan 1, 2013
5.82
+0.392
7.21%
jan 1, 2014
5.712
-0.108
-1.85%
jan 1, 2015
5.318
-0.395
-6.91%
jan 1, 2016
5.592
+0.275
5.16%
Ranking of countries by current statistics by years


Comments: