29
/
en
AIzaSyAYiBZKx7MnpbEhh9jyipgxe19OcubqV5w
April 1, 2024
79844
Barbados
BRB
true
2
1
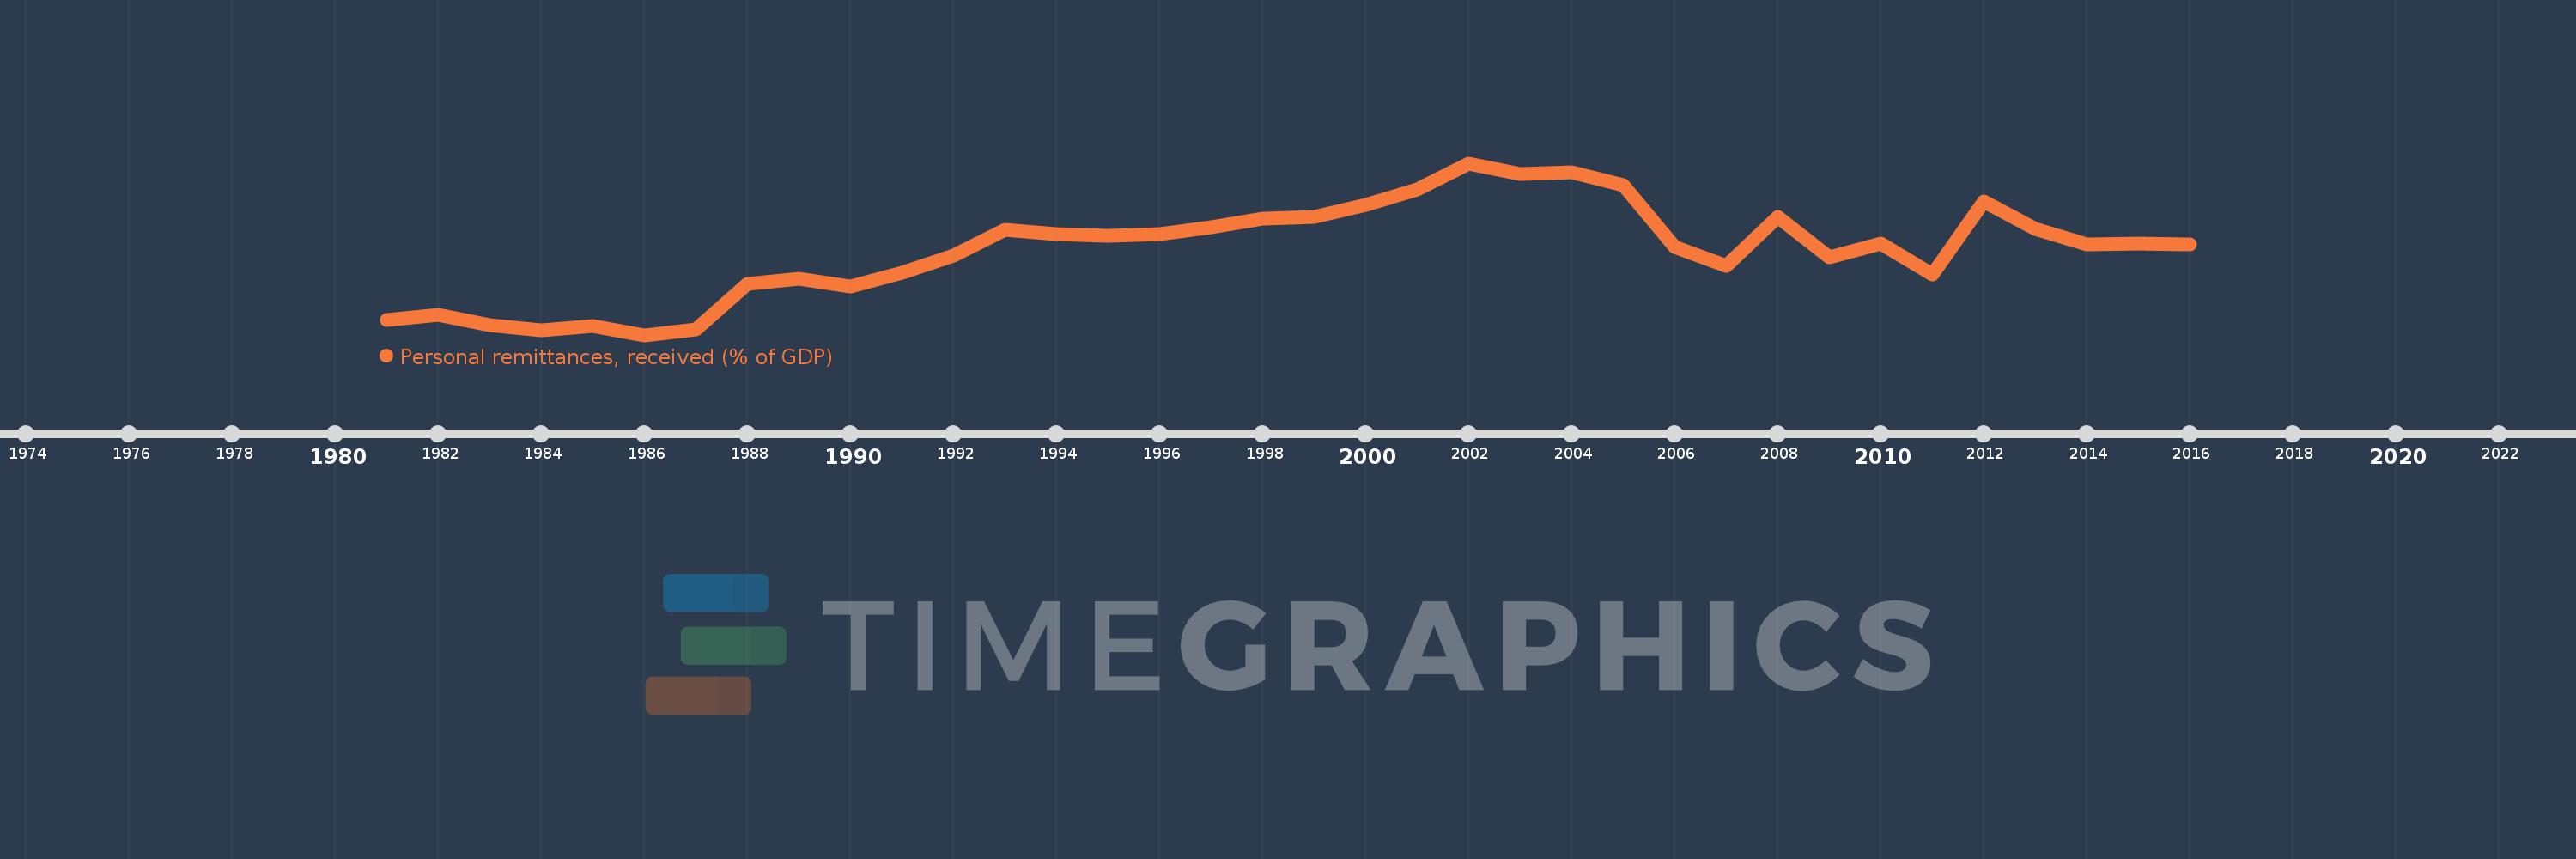
Personal remittances, received (% of GDP)
2016,2015,2014,2013,2012,2011,2010,2009,2008,2007,2006,2005,2004,2003,2002,2001,2000,1999,1998,1997,1996,1995,1994,1993,1992,1991,1990,1989,1988,1987,1986,1985,1984,1983,1982,1981
This statistics in other country:
AfghanistanAlbaniaAlgeriaAngolaAntigua and BarbudaArab WorldArgentinaArmeniaArubaAustraliaAustriaAzerbaijanBangladeshBarbadosBelarusBelgiumBelizeBeninBermudaBhutanBoliviaBosnia and HerzegovinaBotswanaBrazilBulgariaBurkina FasoBurundiCabo VerdeCambodiaCameroonCanadaCaribbean small statesCentral African RepublicCentral Europe and the BalticsChadChileChinaColombiaComorosCongo, Dem. Rep.Congo, Rep.Costa RicaCote d'IvoireCroatiaCyprusCzech RepublicDenmarkDjiboutiDominicaDominican RepublicEarly-demographic dividendEast Asia & PacificEast Asia & Pacific (excluding high income)East Asia & Pacific (IDA & IBRD countries)EcuadorEgypt, Arab Rep.El SalvadorEquatorial GuineaEritreaEstoniaEthiopiaEuro areaEurope & Central AsiaEurope & Central Asia (excluding high income)Europe & Central Asia (IDA & IBRD countries)European UnionFaroe IslandsFijiFinlandFragile and conflict affected situationsFranceGabonGambia, TheGeorgiaGermanyGhanaGreeceGrenadaGuatemalaGuineaGuinea-BissauGuyanaHaitiHeavily indebted poor countries (HIPC)High incomeHondurasHong Kong SAR, ChinaHungaryIBRD onlyIcelandIDA & IBRD totalIDA blendIDA onlyIDA totalIndiaIndonesiaIran, Islamic Rep.IraqIrelandIsraelItalyJamaicaJapanJordanKazakhstanKenyaKiribatiKorea, Rep.KosovoKuwaitKyrgyz RepublicLao PDRLate-demographic dividendLatin America & Caribbean Latin America & Caribbean (excluding high income)Latin America & the Caribbean (IDA & IBRD countries)LatviaLeast developed countries: UN classificationLebanonLesothoLiberiaLibyaLithuaniaLow & middle incomeLow incomeLower middle incomeLuxembourgMacao SAR, ChinaMacedonia, FYRMadagascarMalawiMalaysiaMaldivesMaliMaltaMarshall IslandsMauritaniaMauritiusMexicoMicronesia, Fed. Sts.Middle East & North AfricaMiddle East & North Africa (excluding high income)Middle East & North Africa (IDA & IBRD countries)Middle incomeMoldovaMongoliaMontenegroMoroccoMozambiqueMyanmarNamibiaNepalNetherlandsNew ZealandNicaraguaNigerNigeriaNorth AmericaNorwayOECD membersOmanOther small statesPacific island small statesPakistanPalauPanamaPapua New GuineaParaguayPeruPhilippinesPolandPortugalPost-demographic dividendPre-demographic dividendQatarRomaniaRussian FederationRwandaSamoaSao Tome and PrincipeSaudi ArabiaSenegalSerbiaSeychellesSierra LeoneSlovak RepublicSloveniaSmall statesSolomon IslandsSouth AfricaSouth AsiaSouth Asia (IDA & IBRD)South SudanSpainSri LankaSt. Kitts and NevisSt. LuciaSt. Vincent and the GrenadinesSub-Saharan Africa Sub-Saharan Africa (excluding high income)Sub-Saharan Africa (IDA & IBRD countries)SudanSurinameSwazilandSwedenSwitzerlandSyrian Arab RepublicTajikistanTanzaniaThailandTimor-LesteTogoTongaTrinidad and TobagoTunisiaTurkeyTurkmenistanTuvaluUgandaUkraineUnited KingdomUnited StatesUpper middle incomeUruguayUzbekistanVanuatuVenezuela, RBVietnamWest Bank and GazaWorldYemen, Rep.ZambiaZimbabwe Timeline:
This timeline shows a graph from 1981 to 2016 of Barbados. No data until 1980. Number of actual observations by date: 36.
Source name:
World Development Indicators
Source organization:
World Bank staff estimates based on IMF balance of payments data, and World Bank and OECD GDP estimates.
Categories, topics:
Economy & Growth, Financial Sector
Last updated:
apr 23, 2017
Indicators value changes by year
At the date of observation
Value
Absolute change
Change from previous value
jan 1, 1981
0.899
+0.899
0.0%
jan 1, 1982
0.992
+0.093
10.33%
jan 1, 1983
0.777
-0.214
-21.61%
jan 1, 1984
0.684
-0.094
-12.05%
jan 1, 1985
0.772
+0.088
12.91%
jan 1, 1986
0.578
-0.194
-25.12%
jan 1, 1987
0.698
+0.12
20.7%
jan 1, 1988
1.655
+0.957
137.11%
jan 1, 1989
1.762
+0.108
6.52%
jan 1, 1990
1.595
-0.167
-9.5%
jan 1, 1991
1.883
+0.289
18.09%
jan 1, 1992
2.234
+0.351
18.63%
jan 1, 1993
2.785
+0.55
24.63%
jan 1, 1994
2.683
-0.102
-3.66%
jan 1, 1995
2.659
-0.024
-0.89%
jan 1, 1996
2.692
+0.033
1.26%
jan 1, 1997
2.828
+0.135
5.03%
jan 1, 1998
3.02
+0.193
6.82%
jan 1, 1999
3.041
+0.02
0.67%
jan 1, 2000
3.298
+0.258
8.48%
jan 1, 2001
3.626
+0.328
9.94%
jan 1, 2002
4.17
+0.543
14.98%
jan 1, 2003
3.946
-0.224
-5.37%
jan 1, 2004
3.985
+0.039
1.0%
jan 1, 2005
3.714
-0.271
-6.81%
jan 1, 2006
2.424
-1.29
-34.74%
jan 1, 2007
2.03
-0.394
-16.24%
jan 1, 2008
3.05
+1.021
50.28%
jan 1, 2009
2.201
-0.849
-27.83%
jan 1, 2010
2.488
+0.287
13.02%
jan 1, 2011
1.841
-0.647
-26.0%
jan 1, 2012
3.379
+1.538
83.54%
jan 1, 2013
2.796
-0.584
-17.27%
jan 1, 2014
2.478
-0.318
-11.36%
jan 1, 2015
2.488
+0.011
0.42%
jan 1, 2016
2.47
-0.018
-0.74%
Ranking of countries by current statistics by years


Comments: