29
/
en
AIzaSyAYiBZKx7MnpbEhh9jyipgxe19OcubqV5w
April 1, 2024
215685
Oman
OMN
true
2
1
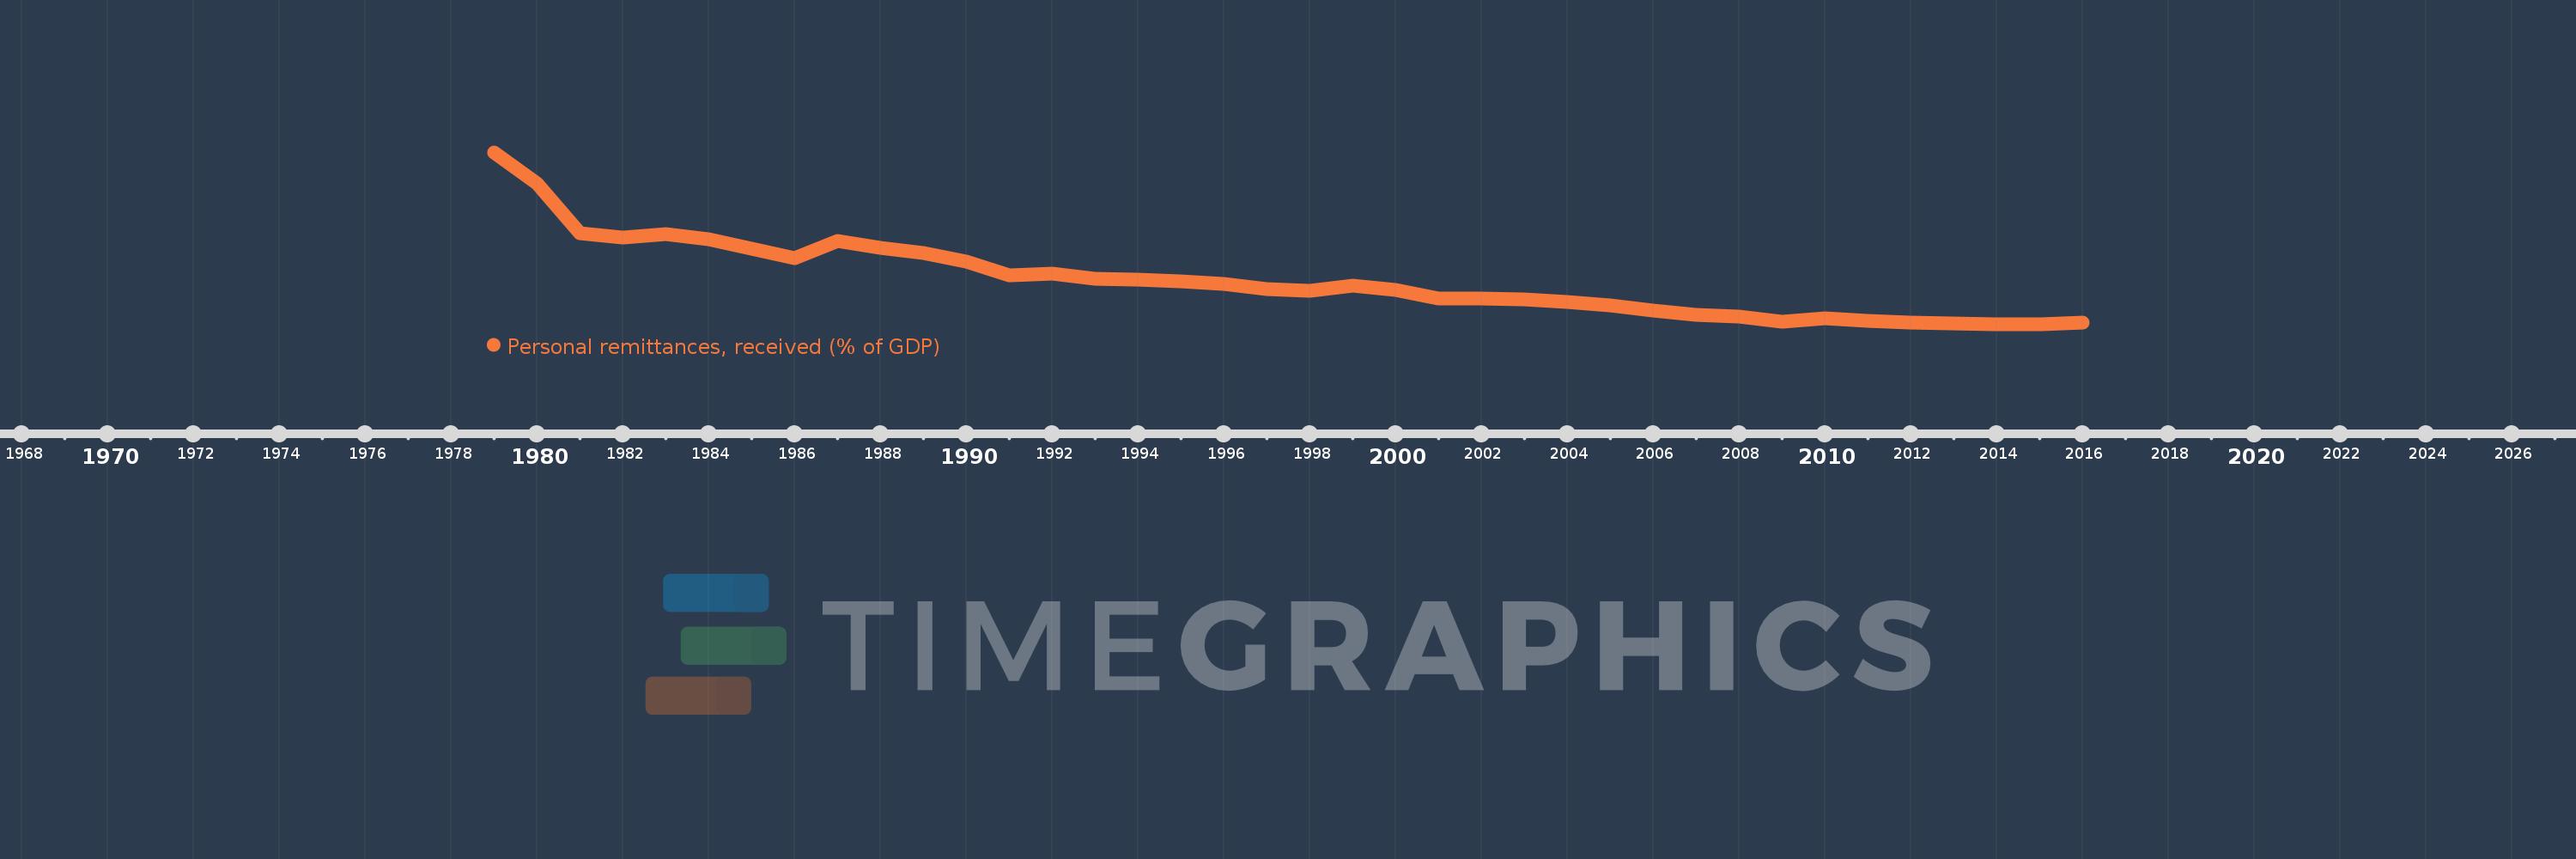
Personal remittances, received (% of GDP)
2016,2015,2014,2013,2012,2011,2010,2009,2008,2007,2006,2005,2004,2003,2002,2001,2000,1999,1998,1997,1996,1995,1994,1993,1992,1991,1990,1989,1988,1987,1986,1985,1984,1983,1982,1981,1980,1979
This statistics in other country:
AfghanistanAlbaniaAlgeriaAngolaAntigua and BarbudaArab WorldArgentinaArmeniaArubaAustraliaAustriaAzerbaijanBangladeshBarbadosBelarusBelgiumBelizeBeninBermudaBhutanBoliviaBosnia and HerzegovinaBotswanaBrazilBulgariaBurkina FasoBurundiCabo VerdeCambodiaCameroonCanadaCaribbean small statesCentral African RepublicCentral Europe and the BalticsChadChileChinaColombiaComorosCongo, Dem. Rep.Congo, Rep.Costa RicaCote d'IvoireCroatiaCyprusCzech RepublicDenmarkDjiboutiDominicaDominican RepublicEarly-demographic dividendEast Asia & PacificEast Asia & Pacific (excluding high income)East Asia & Pacific (IDA & IBRD countries)EcuadorEgypt, Arab Rep.El SalvadorEquatorial GuineaEritreaEstoniaEthiopiaEuro areaEurope & Central AsiaEurope & Central Asia (excluding high income)Europe & Central Asia (IDA & IBRD countries)European UnionFaroe IslandsFijiFinlandFragile and conflict affected situationsFranceGabonGambia, TheGeorgiaGermanyGhanaGreeceGrenadaGuatemalaGuineaGuinea-BissauGuyanaHaitiHeavily indebted poor countries (HIPC)High incomeHondurasHong Kong SAR, ChinaHungaryIBRD onlyIcelandIDA & IBRD totalIDA blendIDA onlyIDA totalIndiaIndonesiaIran, Islamic Rep.IraqIrelandIsraelItalyJamaicaJapanJordanKazakhstanKenyaKiribatiKorea, Rep.KosovoKuwaitKyrgyz RepublicLao PDRLate-demographic dividendLatin America & Caribbean Latin America & Caribbean (excluding high income)Latin America & the Caribbean (IDA & IBRD countries)LatviaLeast developed countries: UN classificationLebanonLesothoLiberiaLibyaLithuaniaLow & middle incomeLow incomeLower middle incomeLuxembourgMacao SAR, ChinaMacedonia, FYRMadagascarMalawiMalaysiaMaldivesMaliMaltaMarshall IslandsMauritaniaMauritiusMexicoMicronesia, Fed. Sts.Middle East & North AfricaMiddle East & North Africa (excluding high income)Middle East & North Africa (IDA & IBRD countries)Middle incomeMoldovaMongoliaMontenegroMoroccoMozambiqueMyanmarNamibiaNepalNetherlandsNew ZealandNicaraguaNigerNigeriaNorth AmericaNorwayOECD membersOmanOther small statesPacific island small statesPakistanPalauPanamaPapua New GuineaParaguayPeruPhilippinesPolandPortugalPost-demographic dividendPre-demographic dividendQatarRomaniaRussian FederationRwandaSamoaSao Tome and PrincipeSaudi ArabiaSenegalSerbiaSeychellesSierra LeoneSlovak RepublicSloveniaSmall statesSolomon IslandsSouth AfricaSouth AsiaSouth Asia (IDA & IBRD)South SudanSpainSri LankaSt. Kitts and NevisSt. LuciaSt. Vincent and the GrenadinesSub-Saharan Africa Sub-Saharan Africa (excluding high income)Sub-Saharan Africa (IDA & IBRD countries)SudanSurinameSwazilandSwedenSwitzerlandSyrian Arab RepublicTajikistanTanzaniaThailandTimor-LesteTogoTongaTrinidad and TobagoTunisiaTurkeyTurkmenistanTuvaluUgandaUkraineUnited KingdomUnited StatesUpper middle incomeUruguayUzbekistanVanuatuVenezuela, RBVietnamWest Bank and GazaWorldYemen, Rep.ZambiaZimbabwe Timeline:
This timeline shows a graph from 1979 to 2016 of Oman. No data until 1978. Number of actual observations by date: 38.
Source name:
World Development Indicators
Source organization:
World Bank staff estimates based on IMF balance of payments data, and World Bank and OECD GDP estimates.
Categories, topics:
Economy & Growth, Financial Sector
Last updated:
apr 23, 2017
Indicators value changes by year
At the date of observation
Value
Absolute change
Change from previous value
jan 1, 1979
1.057
+1.057
0.0%
jan 1, 1980
0.876
-0.18
-17.06%
jan 1, 1981
0.581
-0.296
-33.72%
jan 1, 1982
0.558
-0.022
-3.86%
jan 1, 1983
0.575
+0.016
2.95%
jan 1, 1984
0.547
-0.027
-4.76%
jan 1, 1985
0.492
-0.055
-10.08%
jan 1, 1986
0.434
-0.058
-11.83%
jan 1, 1987
0.536
+0.102
23.53%
jan 1, 1988
0.499
-0.037
-6.85%
jan 1, 1989
0.465
-0.034
-6.86%
jan 1, 1990
0.416
-0.049
-10.52%
jan 1, 1991
0.334
-0.082
-19.79%
jan 1, 1992
0.344
+0.01
3.03%
jan 1, 1993
0.313
-0.031
-8.92%
jan 1, 1994
0.312
-0.001
-0.33%
jan 1, 1995
0.302
-0.01
-3.3%
jan 1, 1996
0.283
-0.019
-6.4%
jan 1, 1997
0.255
-0.027
-9.68%
jan 1, 1998
0.246
-0.009
-3.53%
jan 1, 1999
0.277
+0.031
12.44%
jan 1, 2000
0.248
-0.029
-10.34%
jan 1, 2001
0.2
-0.048
-19.47%
jan 1, 2002
0.201
+0.001
0.31%
jan 1, 2003
0.194
-0.007
-3.43%
jan 1, 2004
0.18
-0.013
-6.89%
jan 1, 2005
0.158
-0.023
-12.64%
jan 1, 2006
0.126
-0.032
-20.33%
jan 1, 2007
0.105
-0.021
-16.48%
jan 1, 2008
0.093
-0.012
-11.57%
jan 1, 2009
0.064
-0.029
-30.9%
jan 1, 2010
0.081
+0.017
25.87%
jan 1, 2011
0.067
-0.014
-17.48%
jan 1, 2012
0.057
-0.009
-13.68%
jan 1, 2013
0.051
-0.007
-11.41%
jan 1, 2014
0.049
-0.001
-2.85%
jan 1, 2015
0.048
-0.001
-2.59%
jan 1, 2016
0.056
+0.008
16.04%
Ranking of countries by current statistics by years


Comments: