29
/
en
AIzaSyAYiBZKx7MnpbEhh9jyipgxe19OcubqV5w
April 1, 2024
250215
St. Kitts and Nevis
KNA
true
2
1
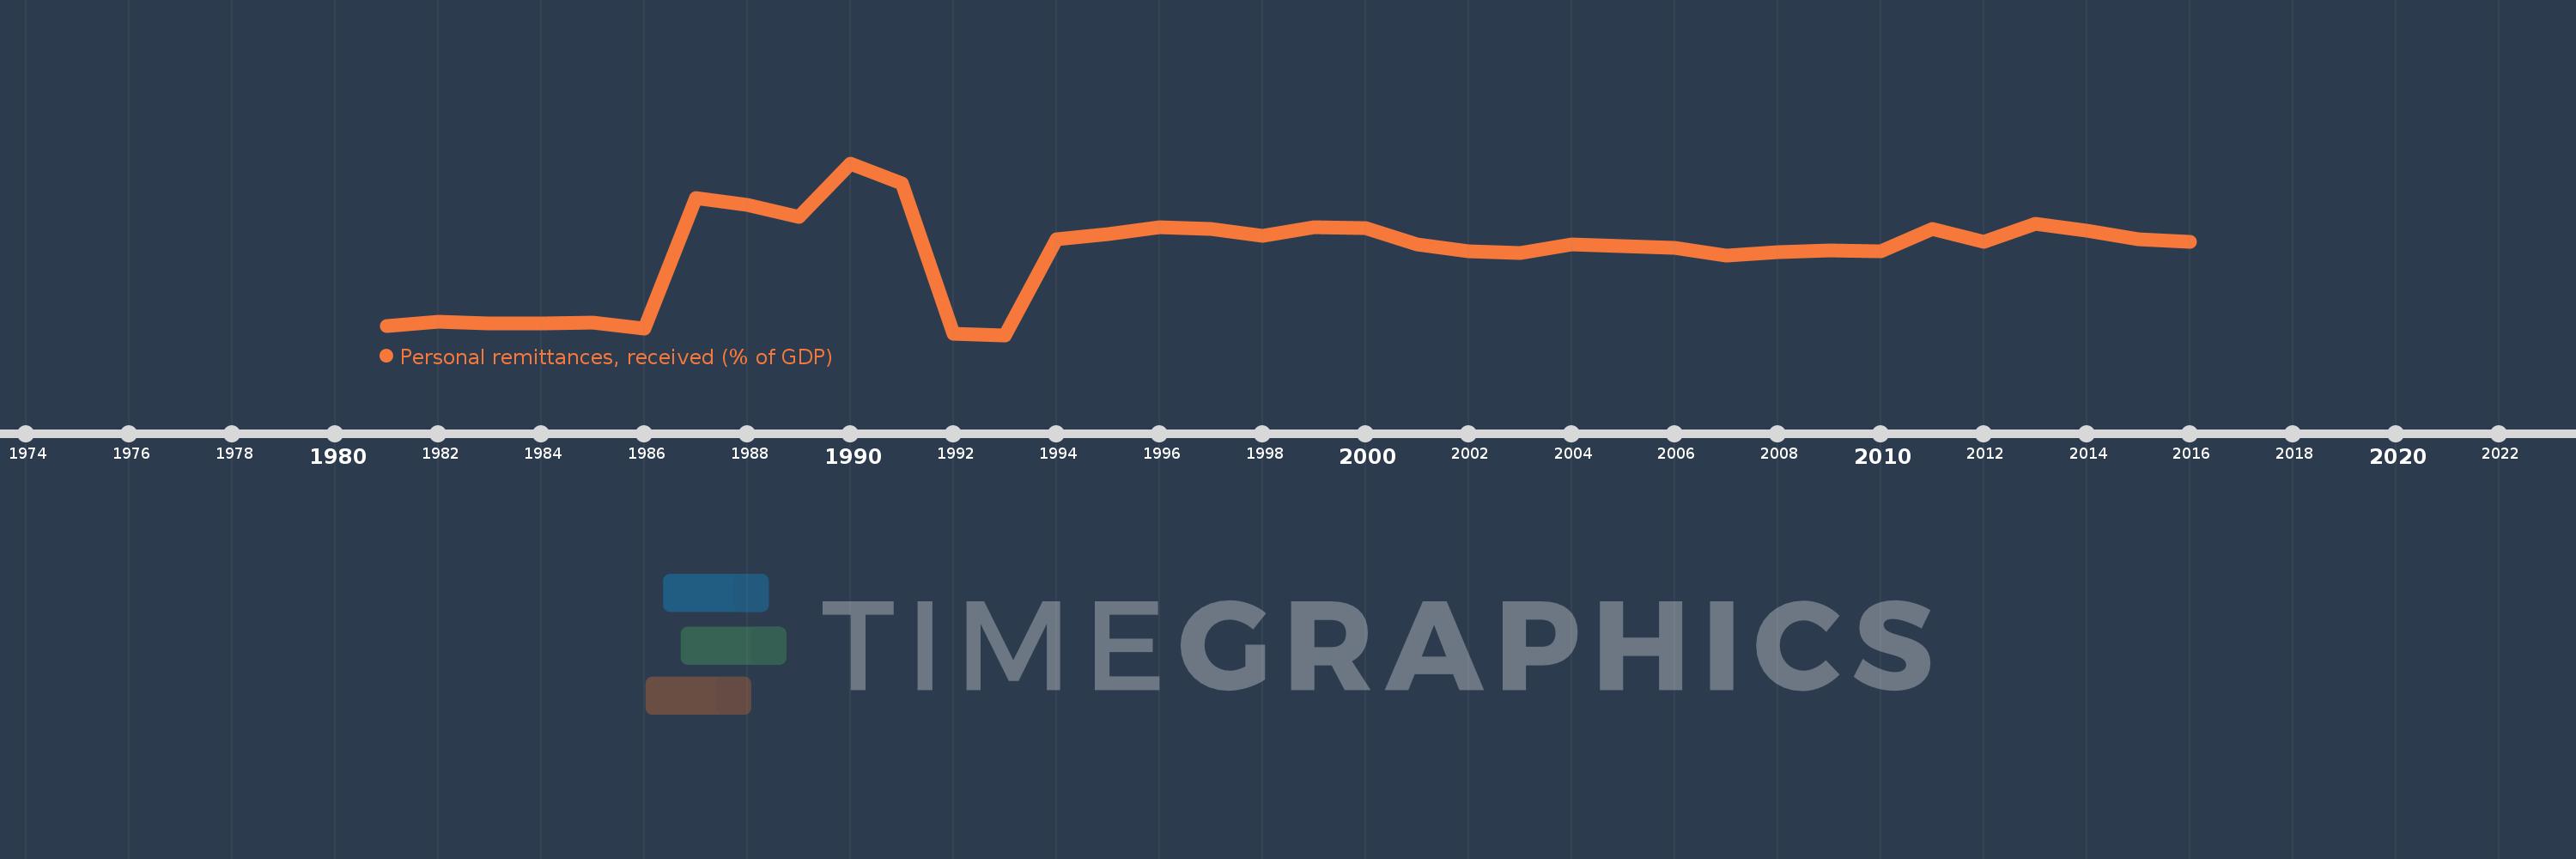
Personal remittances, received (% of GDP)
2016,2015,2014,2013,2012,2011,2010,2009,2008,2007,2006,2005,2004,2003,2002,2001,2000,1999,1998,1997,1996,1995,1994,1993,1992,1991,1990,1989,1988,1987,1986,1985,1984,1983,1982,1981
This statistics in other country:
AfghanistanAlbaniaAlgeriaAngolaAntigua and BarbudaArab WorldArgentinaArmeniaArubaAustraliaAustriaAzerbaijanBangladeshBarbadosBelarusBelgiumBelizeBeninBermudaBhutanBoliviaBosnia and HerzegovinaBotswanaBrazilBulgariaBurkina FasoBurundiCabo VerdeCambodiaCameroonCanadaCaribbean small statesCentral African RepublicCentral Europe and the BalticsChadChileChinaColombiaComorosCongo, Dem. Rep.Congo, Rep.Costa RicaCote d'IvoireCroatiaCyprusCzech RepublicDenmarkDjiboutiDominicaDominican RepublicEarly-demographic dividendEast Asia & PacificEast Asia & Pacific (excluding high income)East Asia & Pacific (IDA & IBRD countries)EcuadorEgypt, Arab Rep.El SalvadorEquatorial GuineaEritreaEstoniaEthiopiaEuro areaEurope & Central AsiaEurope & Central Asia (excluding high income)Europe & Central Asia (IDA & IBRD countries)European UnionFaroe IslandsFijiFinlandFragile and conflict affected situationsFranceGabonGambia, TheGeorgiaGermanyGhanaGreeceGrenadaGuatemalaGuineaGuinea-BissauGuyanaHaitiHeavily indebted poor countries (HIPC)High incomeHondurasHong Kong SAR, ChinaHungaryIBRD onlyIcelandIDA & IBRD totalIDA blendIDA onlyIDA totalIndiaIndonesiaIran, Islamic Rep.IraqIrelandIsraelItalyJamaicaJapanJordanKazakhstanKenyaKiribatiKorea, Rep.KosovoKuwaitKyrgyz RepublicLao PDRLate-demographic dividendLatin America & Caribbean Latin America & Caribbean (excluding high income)Latin America & the Caribbean (IDA & IBRD countries)LatviaLeast developed countries: UN classificationLebanonLesothoLiberiaLibyaLithuaniaLow & middle incomeLow incomeLower middle incomeLuxembourgMacao SAR, ChinaMacedonia, FYRMadagascarMalawiMalaysiaMaldivesMaliMaltaMarshall IslandsMauritaniaMauritiusMexicoMicronesia, Fed. Sts.Middle East & North AfricaMiddle East & North Africa (excluding high income)Middle East & North Africa (IDA & IBRD countries)Middle incomeMoldovaMongoliaMontenegroMoroccoMozambiqueMyanmarNamibiaNepalNetherlandsNew ZealandNicaraguaNigerNigeriaNorth AmericaNorwayOECD membersOmanOther small statesPacific island small statesPakistanPalauPanamaPapua New GuineaParaguayPeruPhilippinesPolandPortugalPost-demographic dividendPre-demographic dividendQatarRomaniaRussian FederationRwandaSamoaSao Tome and PrincipeSaudi ArabiaSenegalSerbiaSeychellesSierra LeoneSlovak RepublicSloveniaSmall statesSolomon IslandsSouth AfricaSouth AsiaSouth Asia (IDA & IBRD)South SudanSpainSri LankaSt. Kitts and NevisSt. LuciaSt. Vincent and the GrenadinesSub-Saharan Africa Sub-Saharan Africa (excluding high income)Sub-Saharan Africa (IDA & IBRD countries)SudanSurinameSwazilandSwedenSwitzerlandSyrian Arab RepublicTajikistanTanzaniaThailandTimor-LesteTogoTongaTrinidad and TobagoTunisiaTurkeyTurkmenistanTuvaluUgandaUkraineUnited KingdomUnited StatesUpper middle incomeUruguayUzbekistanVanuatuVenezuela, RBVietnamWest Bank and GazaWorldYemen, Rep.ZambiaZimbabwe Timeline:
This timeline shows a graph from 1981 to 2016 of St. Kitts and Nevis. No data until 1980. Number of actual observations by date: 36.
Source name:
World Development Indicators
Source organization:
World Bank staff estimates based on IMF balance of payments data, and World Bank and OECD GDP estimates.
Categories, topics:
Economy & Growth, Financial Sector
Last updated:
apr 23, 2017
Indicators value changes by year
Maximum:
10.377
jan 1, 1990
At the date of observation
Value
Absolute change
Change from previous value
jan 1, 1981
1.17
+1.17
0.0%
jan 1, 1982
1.406
+0.236
20.12%
jan 1, 1983
1.304
-0.102
-7.28%
jan 1, 1984
1.306
+0.002
0.16%
jan 1, 1985
1.367
+0.062
4.71%
jan 1, 1986
1.002
-0.365
-26.69%
jan 1, 1987
8.397
+7.394
737.76%
jan 1, 1988
8.034
-0.363
-4.32%
jan 1, 1989
7.338
-0.695
-8.65%
jan 1, 1990
10.377
+3.039
41.41%
jan 1, 1991
9.239
-1.138
-10.97%
jan 1, 1992
0.709
-8.529
-92.32%
jan 1, 1993
0.642
-0.067
-9.43%
jan 1, 1994
6.057
+5.414
842.71%
jan 1, 1995
6.342
+0.285
4.71%
jan 1, 1996
6.75
+0.408
6.43%
jan 1, 1997
6.648
-0.102
-1.52%
jan 1, 1998
6.285
-0.363
-5.46%
jan 1, 1999
6.751
+0.466
7.42%
jan 1, 2000
6.69
-0.062
-0.91%
jan 1, 2001
5.778
-0.911
-13.62%
jan 1, 2002
5.377
-0.401
-6.95%
jan 1, 2003
5.28
-0.097
-1.81%
jan 1, 2004
5.785
+0.506
9.58%
jan 1, 2005
5.676
-0.109
-1.88%
jan 1, 2006
5.572
-0.104
-1.84%
jan 1, 2007
5.162
-0.41
-7.36%
jan 1, 2008
5.36
+0.198
3.84%
jan 1, 2009
5.427
+0.066
1.23%
jan 1, 2010
5.365
-0.061
-1.13%
jan 1, 2011
6.671
+1.306
24.34%
jan 1, 2012
5.931
-0.74
-11.09%
jan 1, 2013
6.951
+1.019
17.19%
jan 1, 2014
6.543
-0.408
-5.86%
jan 1, 2015
6.083
-0.46
-7.03%
jan 1, 2016
5.905
-0.177
-2.92%
Ranking of countries by current statistics by years


Comments: