29
/
en
AIzaSyAYiBZKx7MnpbEhh9jyipgxe19OcubqV5w
April 1, 2024
153906
Iceland
ISL
true
2
1
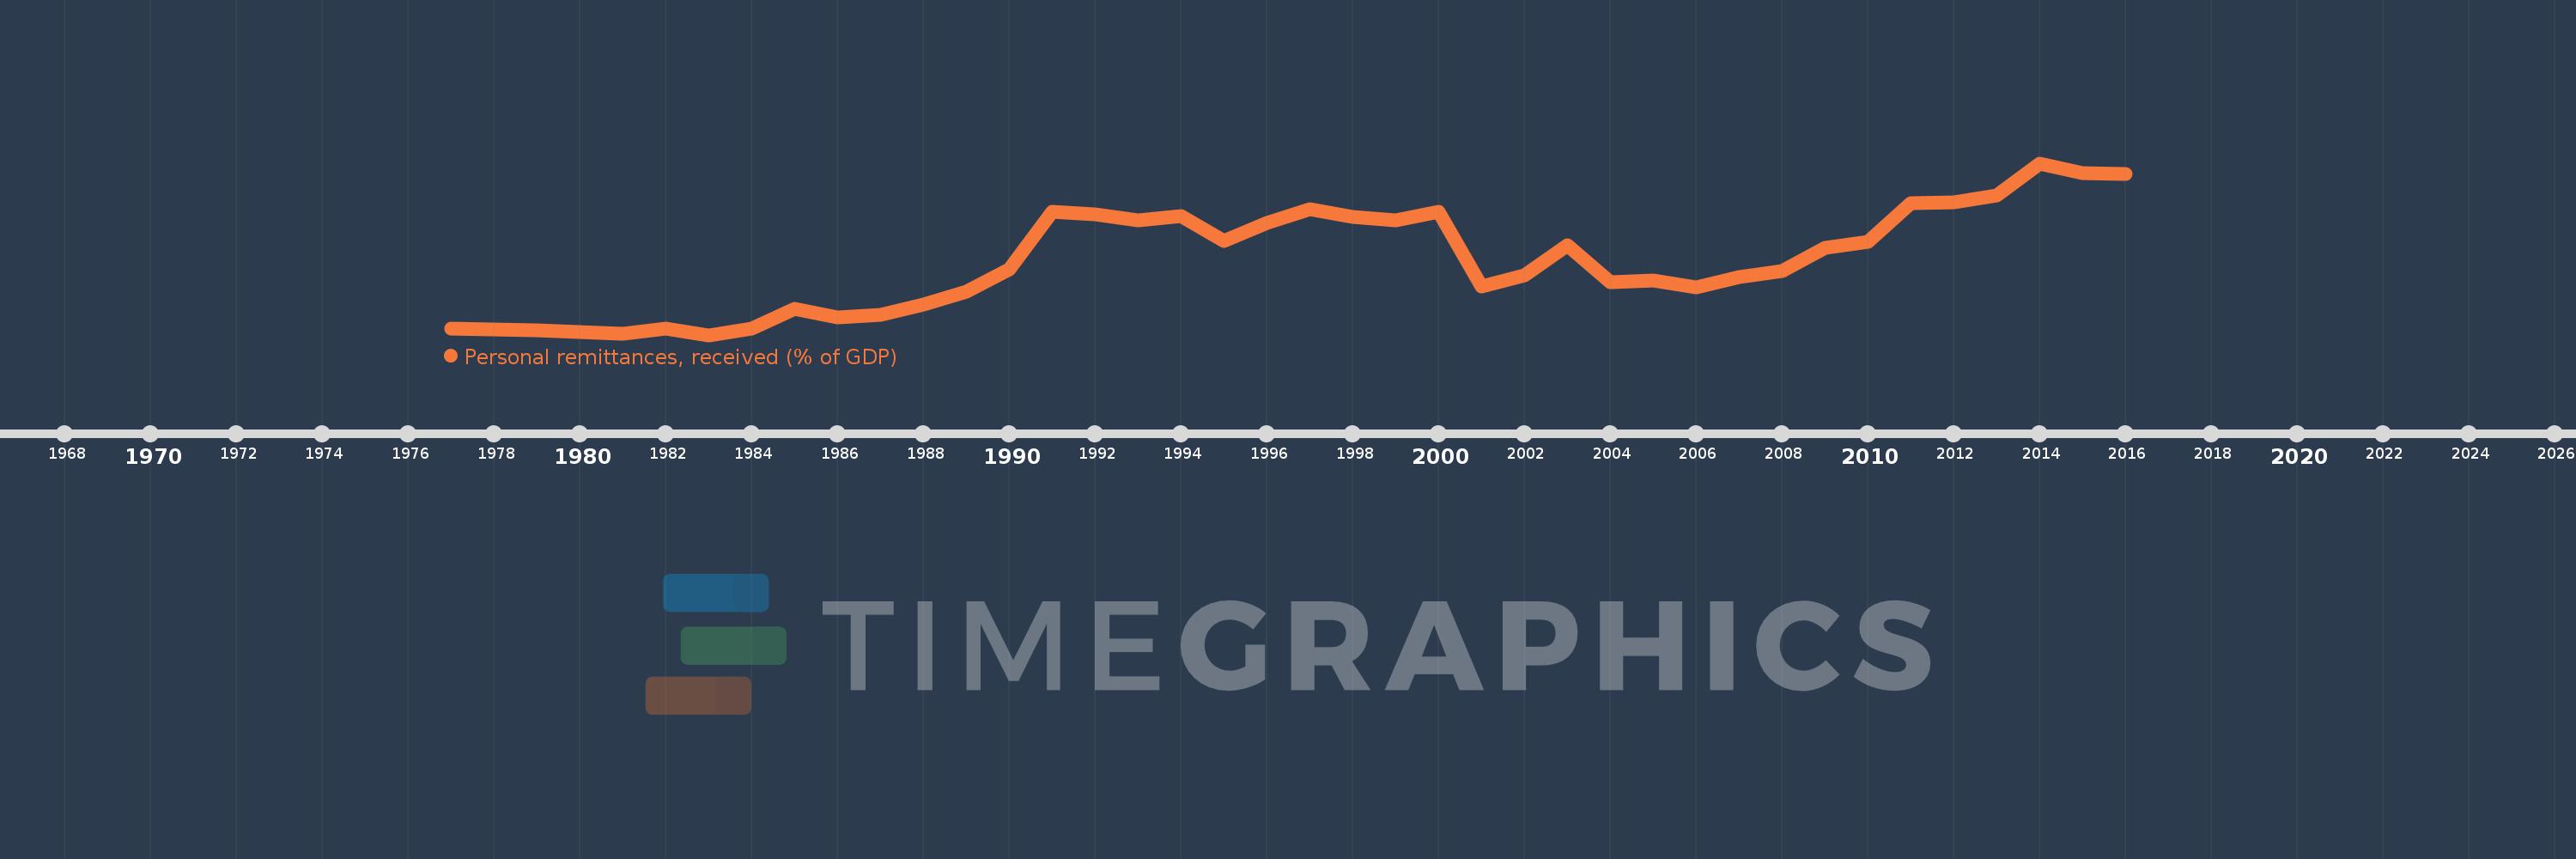
Personal remittances, received (% of GDP)
2016,2015,2014,2013,2012,2011,2010,2009,2008,2007,2006,2005,2004,2003,2002,2001,2000,1999,1998,1997,1996,1995,1994,1993,1992,1991,1990,1989,1988,1987,1986,1985,1984,1983,1982,1981,1980,1979,1978,1977
This statistics in other country:
AfghanistanAlbaniaAlgeriaAngolaAntigua and BarbudaArab WorldArgentinaArmeniaArubaAustraliaAustriaAzerbaijanBangladeshBarbadosBelarusBelgiumBelizeBeninBermudaBhutanBoliviaBosnia and HerzegovinaBotswanaBrazilBulgariaBurkina FasoBurundiCabo VerdeCambodiaCameroonCanadaCaribbean small statesCentral African RepublicCentral Europe and the BalticsChadChileChinaColombiaComorosCongo, Dem. Rep.Congo, Rep.Costa RicaCote d'IvoireCroatiaCyprusCzech RepublicDenmarkDjiboutiDominicaDominican RepublicEarly-demographic dividendEast Asia & PacificEast Asia & Pacific (excluding high income)East Asia & Pacific (IDA & IBRD countries)EcuadorEgypt, Arab Rep.El SalvadorEquatorial GuineaEritreaEstoniaEthiopiaEuro areaEurope & Central AsiaEurope & Central Asia (excluding high income)Europe & Central Asia (IDA & IBRD countries)European UnionFaroe IslandsFijiFinlandFragile and conflict affected situationsFranceGabonGambia, TheGeorgiaGermanyGhanaGreeceGrenadaGuatemalaGuineaGuinea-BissauGuyanaHaitiHeavily indebted poor countries (HIPC)High incomeHondurasHong Kong SAR, ChinaHungaryIBRD onlyIcelandIDA & IBRD totalIDA blendIDA onlyIDA totalIndiaIndonesiaIran, Islamic Rep.IraqIrelandIsraelItalyJamaicaJapanJordanKazakhstanKenyaKiribatiKorea, Rep.KosovoKuwaitKyrgyz RepublicLao PDRLate-demographic dividendLatin America & Caribbean Latin America & Caribbean (excluding high income)Latin America & the Caribbean (IDA & IBRD countries)LatviaLeast developed countries: UN classificationLebanonLesothoLiberiaLibyaLithuaniaLow & middle incomeLow incomeLower middle incomeLuxembourgMacao SAR, ChinaMacedonia, FYRMadagascarMalawiMalaysiaMaldivesMaliMaltaMarshall IslandsMauritaniaMauritiusMexicoMicronesia, Fed. Sts.Middle East & North AfricaMiddle East & North Africa (excluding high income)Middle East & North Africa (IDA & IBRD countries)Middle incomeMoldovaMongoliaMontenegroMoroccoMozambiqueMyanmarNamibiaNepalNetherlandsNew ZealandNicaraguaNigerNigeriaNorth AmericaNorwayOECD membersOmanOther small statesPacific island small statesPakistanPalauPanamaPapua New GuineaParaguayPeruPhilippinesPolandPortugalPost-demographic dividendPre-demographic dividendQatarRomaniaRussian FederationRwandaSamoaSao Tome and PrincipeSaudi ArabiaSenegalSerbiaSeychellesSierra LeoneSlovak RepublicSloveniaSmall statesSolomon IslandsSouth AfricaSouth AsiaSouth Asia (IDA & IBRD)South SudanSpainSri LankaSt. Kitts and NevisSt. LuciaSt. Vincent and the GrenadinesSub-Saharan Africa Sub-Saharan Africa (excluding high income)Sub-Saharan Africa (IDA & IBRD countries)SudanSurinameSwazilandSwedenSwitzerlandSyrian Arab RepublicTajikistanTanzaniaThailandTimor-LesteTogoTongaTrinidad and TobagoTunisiaTurkeyTurkmenistanTuvaluUgandaUkraineUnited KingdomUnited StatesUpper middle incomeUruguayUzbekistanVanuatuVenezuela, RBVietnamWest Bank and GazaWorldYemen, Rep.ZambiaZimbabwe Timeline:
This timeline shows a graph from 1977 to 2016 of Iceland. No data until 1976. Number of actual observations by date: 40.
Source name:
World Development Indicators
Source organization:
World Bank staff estimates based on IMF balance of payments data, and World Bank and OECD GDP estimates.
Categories, topics:
Economy & Growth, Financial Sector
Last updated:
apr 23, 2017
Indicators value changes by year
At the date of observation
Value
Absolute change
Change from previous value
jan 1, 1977
0.083
+0.083
0.0%
jan 1, 1978
0.076
-0.007
-8.21%
jan 1, 1979
0.071
-0.005
-6.9%
jan 1, 1980
0.059
-0.012
-16.86%
jan 1, 1981
0.044
-0.015
-25.54%
jan 1, 1982
0.088
+0.044
100.07%
jan 1, 1983
0.037
-0.051
-57.83%
jan 1, 1984
0.082
+0.045
122.2%
jan 1, 1985
0.235
+0.153
185.49%
jan 1, 1986
0.17
-0.066
-28.01%
jan 1, 1987
0.189
+0.019
11.46%
jan 1, 1988
0.264
+0.075
39.79%
jan 1, 1989
0.364
+0.1
37.75%
jan 1, 1990
0.528
+0.164
45.14%
jan 1, 1991
0.955
+0.427
80.78%
jan 1, 1992
0.938
-0.017
-1.78%
jan 1, 1993
0.894
-0.044
-4.65%
jan 1, 1994
0.923
+0.029
3.24%
jan 1, 1995
0.737
-0.186
-20.1%
jan 1, 1996
0.872
+0.134
18.2%
jan 1, 1997
0.98
+0.109
12.47%
jan 1, 1998
0.917
-0.063
-6.45%
jan 1, 1999
0.895
-0.022
-2.45%
jan 1, 2000
0.955
+0.06
6.69%
jan 1, 2001
0.401
-0.554
-58.03%
jan 1, 2002
0.484
+0.084
20.86%
jan 1, 2003
0.707
+0.223
46.01%
jan 1, 2004
0.434
-0.273
-38.67%
jan 1, 2005
0.445
+0.011
2.6%
jan 1, 2006
0.393
-0.052
-11.76%
jan 1, 2007
0.471
+0.078
19.99%
jan 1, 2008
0.517
+0.046
9.67%
jan 1, 2009
0.685
+0.168
32.58%
jan 1, 2010
0.731
+0.046
6.76%
jan 1, 2011
1.023
+0.292
39.97%
jan 1, 2012
1.028
+0.005
0.49%
jan 1, 2013
1.077
+0.049
4.73%
jan 1, 2014
1.32
+0.243
22.54%
jan 1, 2015
1.249
-0.071
-5.39%
jan 1, 2016
1.243
-0.005
-0.43%
Ranking of countries by current statistics by years


Comments: