29
/
en
AIzaSyAYiBZKx7MnpbEhh9jyipgxe19OcubqV5w
April 1, 2024
236248
Senegal
SEN
true
2
1
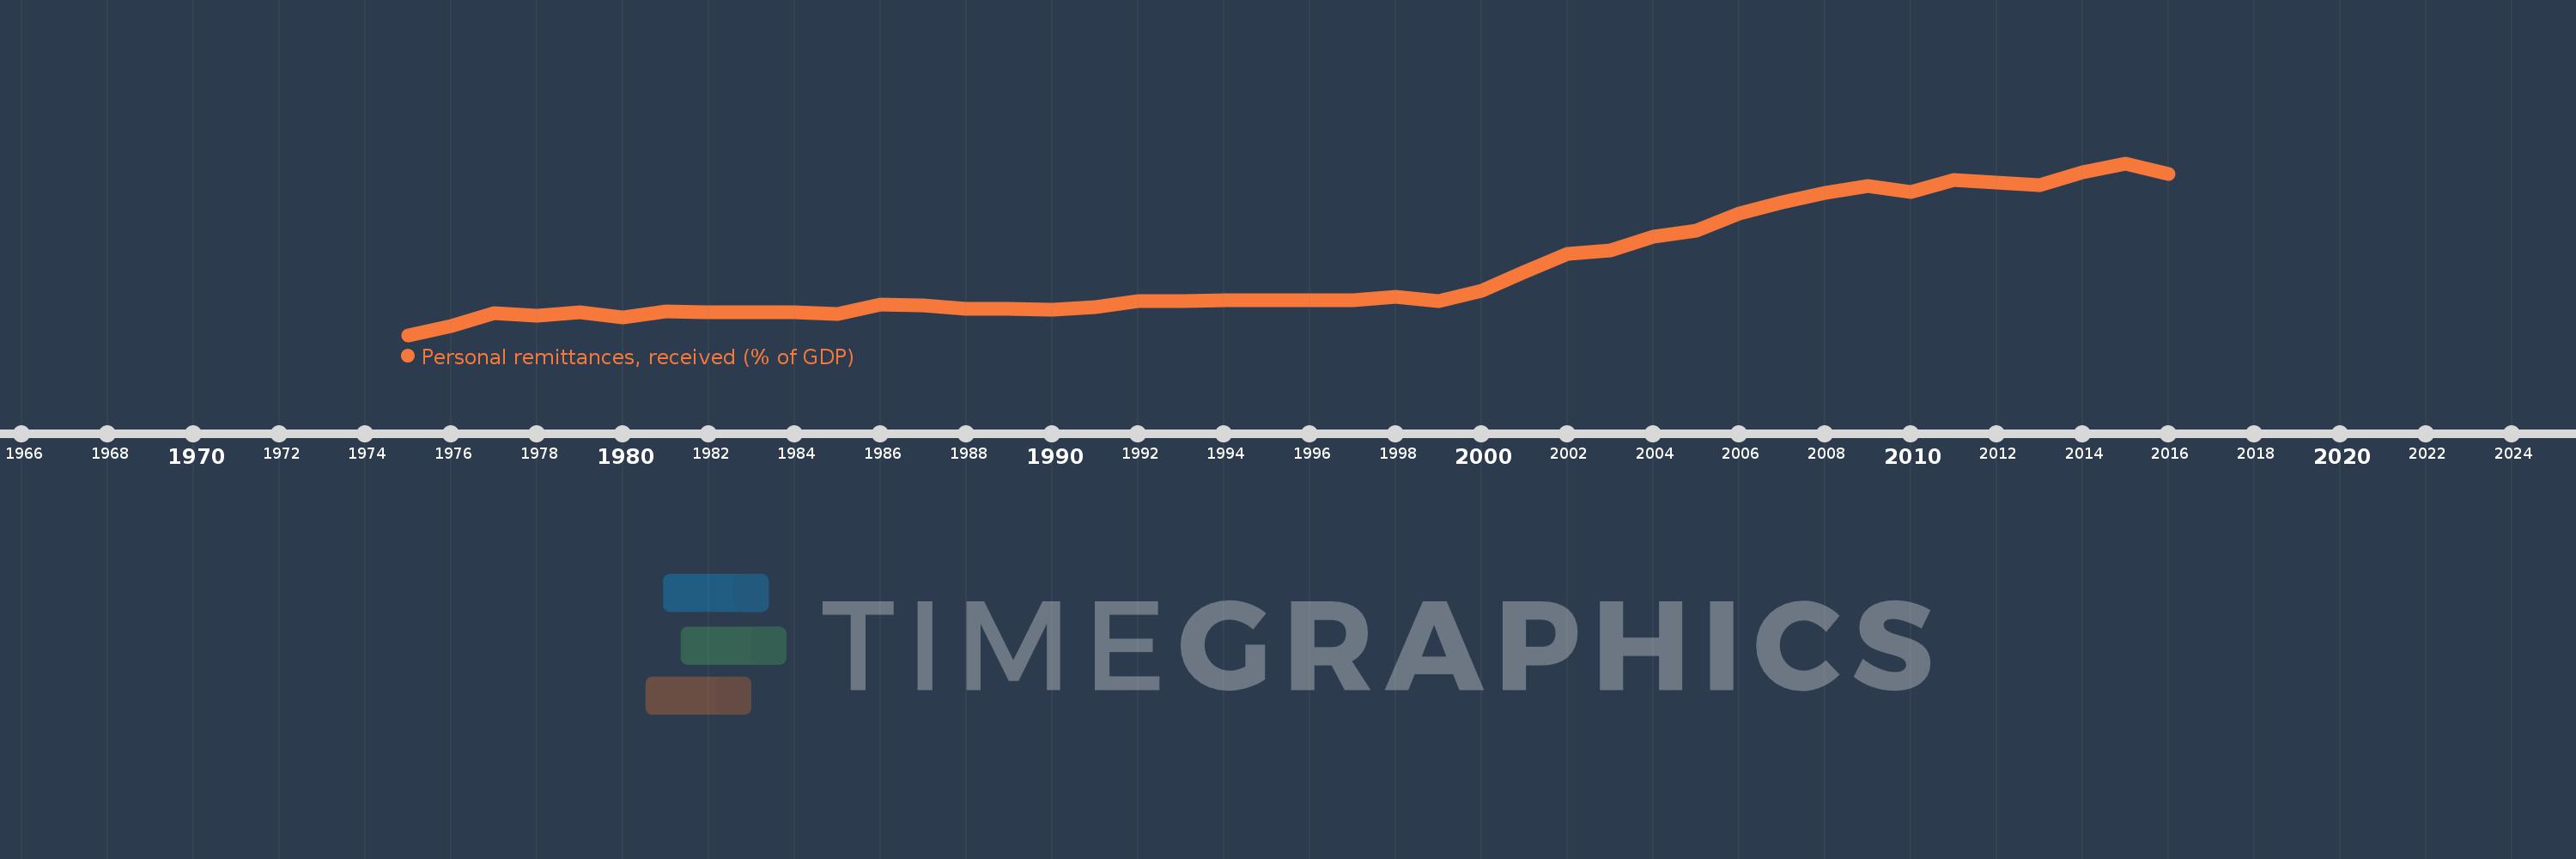
Personal remittances, received (% of GDP)
2016,2015,2014,2013,2012,2011,2010,2009,2008,2007,2006,2005,2004,2003,2002,2001,2000,1999,1998,1997,1996,1995,1994,1993,1992,1991,1990,1989,1988,1987,1986,1985,1984,1983,1982,1981,1980,1979,1978,1977,1976,1975
This statistics in other country:
AfghanistanAlbaniaAlgeriaAngolaAntigua and BarbudaArab WorldArgentinaArmeniaArubaAustraliaAustriaAzerbaijanBangladeshBarbadosBelarusBelgiumBelizeBeninBermudaBhutanBoliviaBosnia and HerzegovinaBotswanaBrazilBulgariaBurkina FasoBurundiCabo VerdeCambodiaCameroonCanadaCaribbean small statesCentral African RepublicCentral Europe and the BalticsChadChileChinaColombiaComorosCongo, Dem. Rep.Congo, Rep.Costa RicaCote d'IvoireCroatiaCyprusCzech RepublicDenmarkDjiboutiDominicaDominican RepublicEarly-demographic dividendEast Asia & PacificEast Asia & Pacific (excluding high income)East Asia & Pacific (IDA & IBRD countries)EcuadorEgypt, Arab Rep.El SalvadorEquatorial GuineaEritreaEstoniaEthiopiaEuro areaEurope & Central AsiaEurope & Central Asia (excluding high income)Europe & Central Asia (IDA & IBRD countries)European UnionFaroe IslandsFijiFinlandFragile and conflict affected situationsFranceGabonGambia, TheGeorgiaGermanyGhanaGreeceGrenadaGuatemalaGuineaGuinea-BissauGuyanaHaitiHeavily indebted poor countries (HIPC)High incomeHondurasHong Kong SAR, ChinaHungaryIBRD onlyIcelandIDA & IBRD totalIDA blendIDA onlyIDA totalIndiaIndonesiaIran, Islamic Rep.IraqIrelandIsraelItalyJamaicaJapanJordanKazakhstanKenyaKiribatiKorea, Rep.KosovoKuwaitKyrgyz RepublicLao PDRLate-demographic dividendLatin America & Caribbean Latin America & Caribbean (excluding high income)Latin America & the Caribbean (IDA & IBRD countries)LatviaLeast developed countries: UN classificationLebanonLesothoLiberiaLibyaLithuaniaLow & middle incomeLow incomeLower middle incomeLuxembourgMacao SAR, ChinaMacedonia, FYRMadagascarMalawiMalaysiaMaldivesMaliMaltaMarshall IslandsMauritaniaMauritiusMexicoMicronesia, Fed. Sts.Middle East & North AfricaMiddle East & North Africa (excluding high income)Middle East & North Africa (IDA & IBRD countries)Middle incomeMoldovaMongoliaMontenegroMoroccoMozambiqueMyanmarNamibiaNepalNetherlandsNew ZealandNicaraguaNigerNigeriaNorth AmericaNorwayOECD membersOmanOther small statesPacific island small statesPakistanPalauPanamaPapua New GuineaParaguayPeruPhilippinesPolandPortugalPost-demographic dividendPre-demographic dividendQatarRomaniaRussian FederationRwandaSamoaSao Tome and PrincipeSaudi ArabiaSenegalSerbiaSeychellesSierra LeoneSlovak RepublicSloveniaSmall statesSolomon IslandsSouth AfricaSouth AsiaSouth Asia (IDA & IBRD)South SudanSpainSri LankaSt. Kitts and NevisSt. LuciaSt. Vincent and the GrenadinesSub-Saharan Africa Sub-Saharan Africa (excluding high income)Sub-Saharan Africa (IDA & IBRD countries)SudanSurinameSwazilandSwedenSwitzerlandSyrian Arab RepublicTajikistanTanzaniaThailandTimor-LesteTogoTongaTrinidad and TobagoTunisiaTurkeyTurkmenistanTuvaluUgandaUkraineUnited KingdomUnited StatesUpper middle incomeUruguayUzbekistanVanuatuVenezuela, RBVietnamWest Bank and GazaWorldYemen, Rep.ZambiaZimbabwe Timeline:
This timeline shows a graph from 1975 to 2016 of Senegal. No data until 1974. Number of actual observations by date: 42.
Source name:
World Development Indicators
Source organization:
World Bank staff estimates based on IMF balance of payments data, and World Bank and OECD GDP estimates.
Categories, topics:
Economy & Growth, Financial Sector
Last updated:
apr 23, 2017
Indicators value changes by year
Maximum:
12.621
jan 1, 2015
At the date of observation
Value
Absolute change
Change from previous value
jan 1, 1975
0.514
+0.514
0.0%
jan 1, 1976
1.177
+0.664
129.19%
jan 1, 1977
2.029
+0.852
72.37%
jan 1, 1978
1.856
-0.173
-8.54%
jan 1, 1979
2.146
+0.291
15.67%
jan 1, 1980
1.744
-0.402
-18.75%
jan 1, 1981
2.199
+0.456
26.12%
jan 1, 1982
2.147
-0.053
-2.4%
jan 1, 1983
2.132
-0.014
-0.66%
jan 1, 1984
2.126
-0.007
-0.32%
jan 1, 1985
1.987
-0.139
-6.52%
jan 1, 1986
2.681
+0.694
34.93%
jan 1, 1987
2.6
-0.081
-3.01%
jan 1, 1988
2.337
-0.263
-10.11%
jan 1, 1989
2.358
+0.02
0.87%
jan 1, 1990
2.295
-0.063
-2.67%
jan 1, 1991
2.485
+0.19
8.28%
jan 1, 1992
2.894
+0.409
16.45%
jan 1, 1993
2.926
+0.032
1.09%
jan 1, 1994
2.994
+0.068
2.33%
jan 1, 1995
2.936
-0.058
-1.93%
jan 1, 1996
2.993
+0.057
1.95%
jan 1, 1997
2.97
-0.023
-0.76%
jan 1, 1998
3.22
+0.25
8.41%
jan 1, 1999
2.931
-0.29
-8.99%
jan 1, 2000
3.616
+0.686
23.4%
jan 1, 2001
4.989
+1.373
37.97%
jan 1, 2002
6.246
+1.257
25.19%
jan 1, 2003
6.459
+0.212
3.4%
jan 1, 2004
7.449
+0.99
15.34%
jan 1, 2005
7.88
+0.431
5.79%
jan 1, 2006
9.06
+1.179
14.97%
jan 1, 2007
9.886
+0.827
9.13%
jan 1, 2008
10.561
+0.675
6.83%
jan 1, 2009
11.036
+0.474
4.49%
jan 1, 2010
10.573
-0.462
-4.19%
jan 1, 2011
11.442
+0.869
8.22%
jan 1, 2012
11.245
-0.197
-1.72%
jan 1, 2013
11.105
-0.14
-1.24%
jan 1, 2014
12.004
+0.899
8.09%
jan 1, 2015
12.621
+0.617
5.14%
jan 1, 2016
11.858
-0.763
-6.04%
Ranking of countries by current statistics by years


Comments: