29
/
en
AIzaSyAYiBZKx7MnpbEhh9jyipgxe19OcubqV5w
April 1, 2024
52945
OECD members
OED
false
2
1
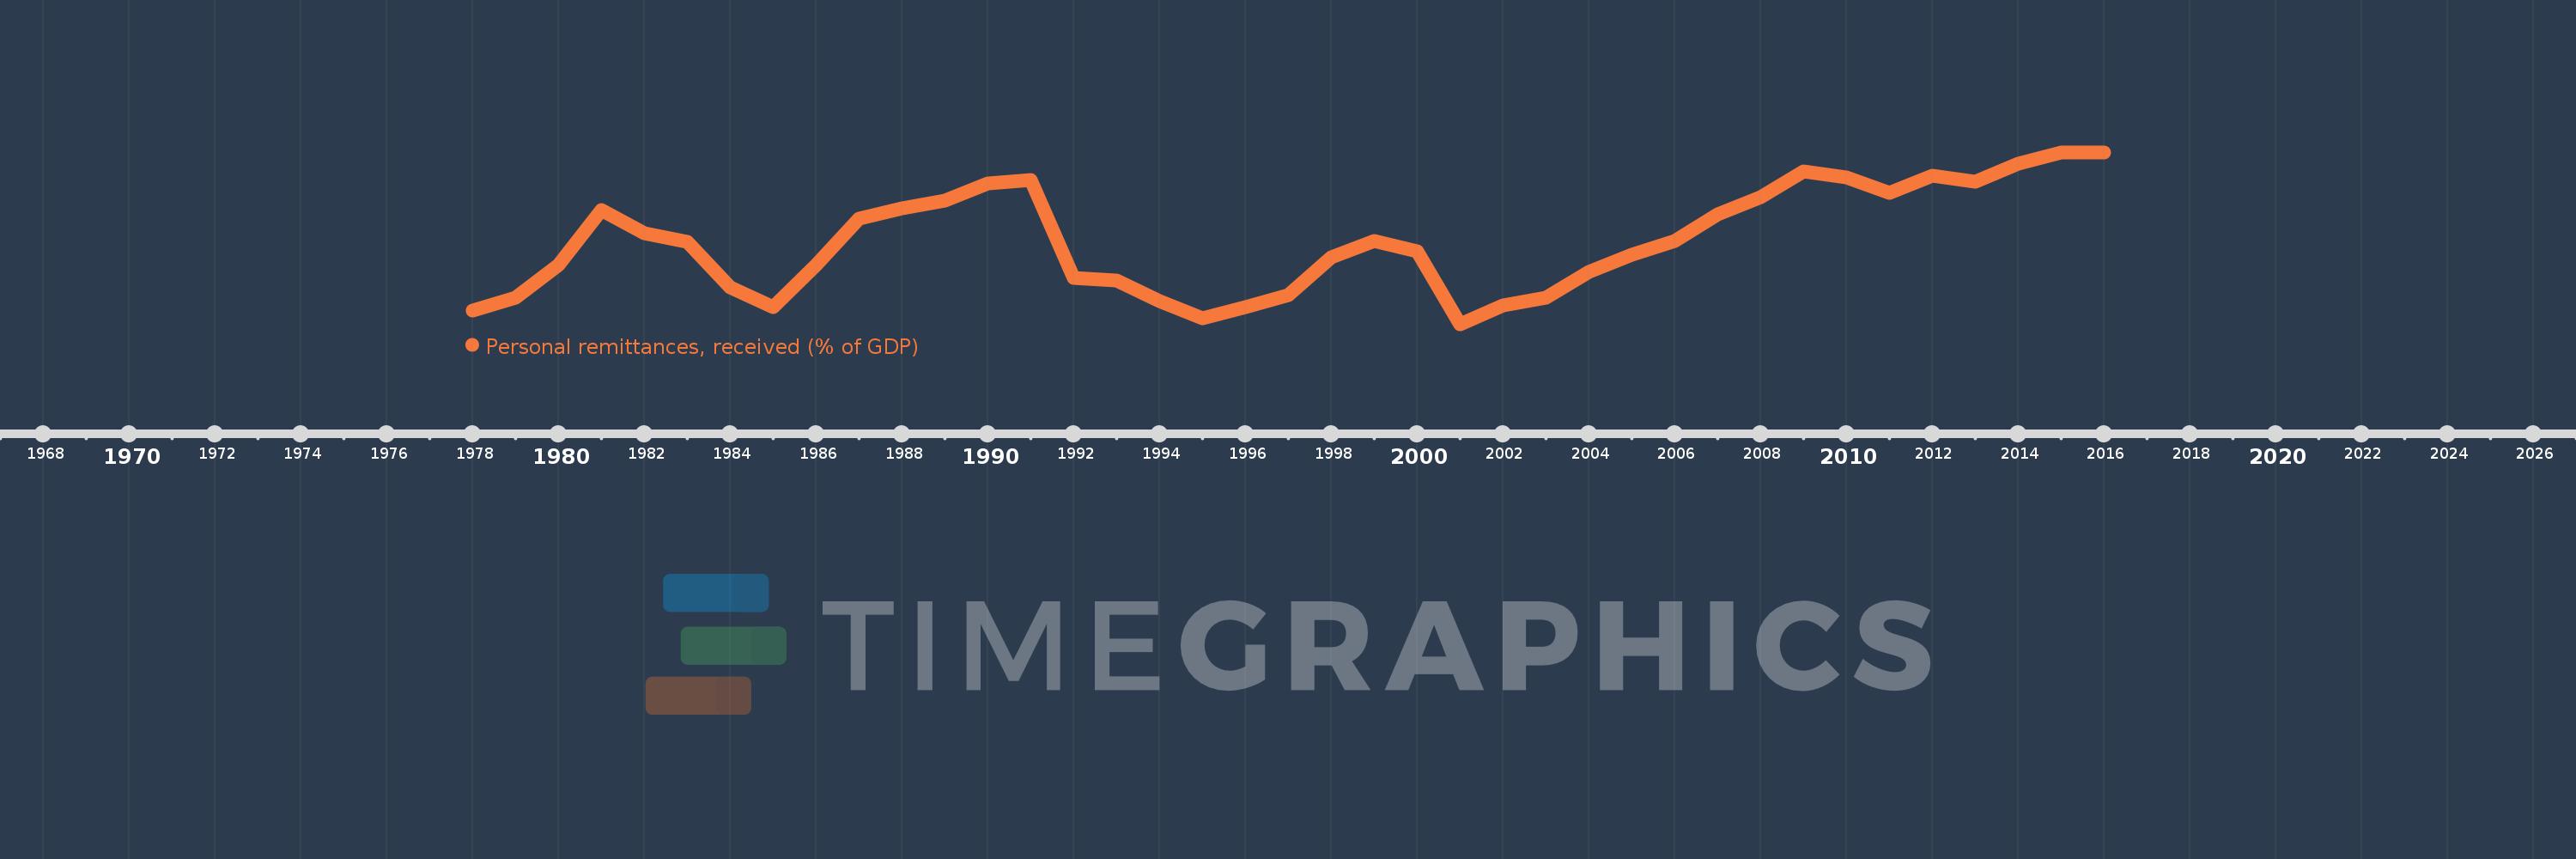
Personal remittances, received (% of GDP)
2016,2015,2014,2013,2012,2011,2010,2009,2008,2007,2006,2005,2004,2003,2002,2001,2000,1999,1998,1997,1996,1995,1994,1993,1992,1991,1990,1989,1988,1987,1986,1985,1984,1983,1982,1981,1980,1979,1978
This statistics in other country:
AfghanistanAlbaniaAlgeriaAngolaAntigua and BarbudaArab WorldArgentinaArmeniaArubaAustraliaAustriaAzerbaijanBangladeshBarbadosBelarusBelgiumBelizeBeninBermudaBhutanBoliviaBosnia and HerzegovinaBotswanaBrazilBulgariaBurkina FasoBurundiCabo VerdeCambodiaCameroonCanadaCaribbean small statesCentral African RepublicCentral Europe and the BalticsChadChileChinaColombiaComorosCongo, Dem. Rep.Congo, Rep.Costa RicaCote d'IvoireCroatiaCyprusCzech RepublicDenmarkDjiboutiDominicaDominican RepublicEarly-demographic dividendEast Asia & PacificEast Asia & Pacific (excluding high income)East Asia & Pacific (IDA & IBRD countries)EcuadorEgypt, Arab Rep.El SalvadorEquatorial GuineaEritreaEstoniaEthiopiaEuro areaEurope & Central AsiaEurope & Central Asia (excluding high income)Europe & Central Asia (IDA & IBRD countries)European UnionFaroe IslandsFijiFinlandFragile and conflict affected situationsFranceGabonGambia, TheGeorgiaGermanyGhanaGreeceGrenadaGuatemalaGuineaGuinea-BissauGuyanaHaitiHeavily indebted poor countries (HIPC)High incomeHondurasHong Kong SAR, ChinaHungaryIBRD onlyIcelandIDA & IBRD totalIDA blendIDA onlyIDA totalIndiaIndonesiaIran, Islamic Rep.IraqIrelandIsraelItalyJamaicaJapanJordanKazakhstanKenyaKiribatiKorea, Rep.KosovoKuwaitKyrgyz RepublicLao PDRLate-demographic dividendLatin America & Caribbean Latin America & Caribbean (excluding high income)Latin America & the Caribbean (IDA & IBRD countries)LatviaLeast developed countries: UN classificationLebanonLesothoLiberiaLibyaLithuaniaLow & middle incomeLow incomeLower middle incomeLuxembourgMacao SAR, ChinaMacedonia, FYRMadagascarMalawiMalaysiaMaldivesMaliMaltaMarshall IslandsMauritaniaMauritiusMexicoMicronesia, Fed. Sts.Middle East & North AfricaMiddle East & North Africa (excluding high income)Middle East & North Africa (IDA & IBRD countries)Middle incomeMoldovaMongoliaMontenegroMoroccoMozambiqueMyanmarNamibiaNepalNetherlandsNew ZealandNicaraguaNigerNigeriaNorth AmericaNorwayOECD membersOmanOther small statesPacific island small statesPakistanPalauPanamaPapua New GuineaParaguayPeruPhilippinesPolandPortugalPost-demographic dividendPre-demographic dividendQatarRomaniaRussian FederationRwandaSamoaSao Tome and PrincipeSaudi ArabiaSenegalSerbiaSeychellesSierra LeoneSlovak RepublicSloveniaSmall statesSolomon IslandsSouth AfricaSouth AsiaSouth Asia (IDA & IBRD)South SudanSpainSri LankaSt. Kitts and NevisSt. LuciaSt. Vincent and the GrenadinesSub-Saharan Africa Sub-Saharan Africa (excluding high income)Sub-Saharan Africa (IDA & IBRD countries)SudanSurinameSwazilandSwedenSwitzerlandSyrian Arab RepublicTajikistanTanzaniaThailandTimor-LesteTogoTongaTrinidad and TobagoTunisiaTurkeyTurkmenistanTuvaluUgandaUkraineUnited KingdomUnited StatesUpper middle incomeUruguayUzbekistanVanuatuVenezuela, RBVietnamWest Bank and GazaWorldYemen, Rep.ZambiaZimbabwe Timeline:
This timeline shows a graph from 1978 to 2016 of OECD members. No data until 1977. Number of actual observations by date: 39.
Source name:
World Development Indicators
Source organization:
World Bank staff estimates based on IMF balance of payments data, and World Bank and OECD GDP estimates.
Categories, topics:
Economy & Growth, Financial Sector
Last updated:
apr 23, 2017
Indicators value changes by year
At the date of observation
Value
Absolute change
Change from previous value
jan 1, 1978
0.223
+0.223
0.0%
jan 1, 1979
0.231
+0.008
3.76%
jan 1, 1980
0.252
+0.021
9.22%
jan 1, 1981
0.288
+0.035
14.05%
jan 1, 1982
0.273
-0.015
-5.17%
jan 1, 1983
0.267
-0.006
-2.22%
jan 1, 1984
0.238
-0.029
-10.76%
jan 1, 1985
0.225
-0.013
-5.53%
jan 1, 1986
0.252
+0.027
11.95%
jan 1, 1987
0.282
+0.03
12.1%
jan 1, 1988
0.289
+0.006
2.18%
jan 1, 1989
0.294
+0.006
1.98%
jan 1, 1990
0.305
+0.01
3.52%
jan 1, 1991
0.307
+0.002
0.77%
jan 1, 1992
0.244
-0.063
-20.47%
jan 1, 1993
0.242
-0.002
-0.99%
jan 1, 1994
0.229
-0.013
-5.23%
jan 1, 1995
0.218
-0.011
-5.0%
jan 1, 1996
0.225
+0.007
3.42%
jan 1, 1997
0.233
+0.008
3.5%
jan 1, 1998
0.257
+0.024
10.11%
jan 1, 1999
0.268
+0.011
4.46%
jan 1, 2000
0.261
-0.007
-2.52%
jan 1, 2001
0.214
-0.047
-18.09%
jan 1, 2002
0.226
+0.012
5.42%
jan 1, 2003
0.231
+0.006
2.55%
jan 1, 2004
0.248
+0.017
7.36%
jan 1, 2005
0.259
+0.01
4.14%
jan 1, 2006
0.268
+0.01
3.83%
jan 1, 2007
0.285
+0.017
6.28%
jan 1, 2008
0.296
+0.01
3.62%
jan 1, 2009
0.313
+0.018
5.93%
jan 1, 2010
0.309
-0.004
-1.31%
jan 1, 2011
0.299
-0.01
-3.38%
jan 1, 2012
0.31
+0.011
3.63%
jan 1, 2013
0.306
-0.003
-1.01%
jan 1, 2014
0.318
+0.012
3.77%
jan 1, 2015
0.325
+0.007
2.23%
jan 1, 2016
0.325
+0.0
0.13%
Ranking of countries by current statistics by years


Comments: