29
/
en
AIzaSyAYiBZKx7MnpbEhh9jyipgxe19OcubqV5w
April 1, 2024
78728
Bangladesh
BGD
true
2
1
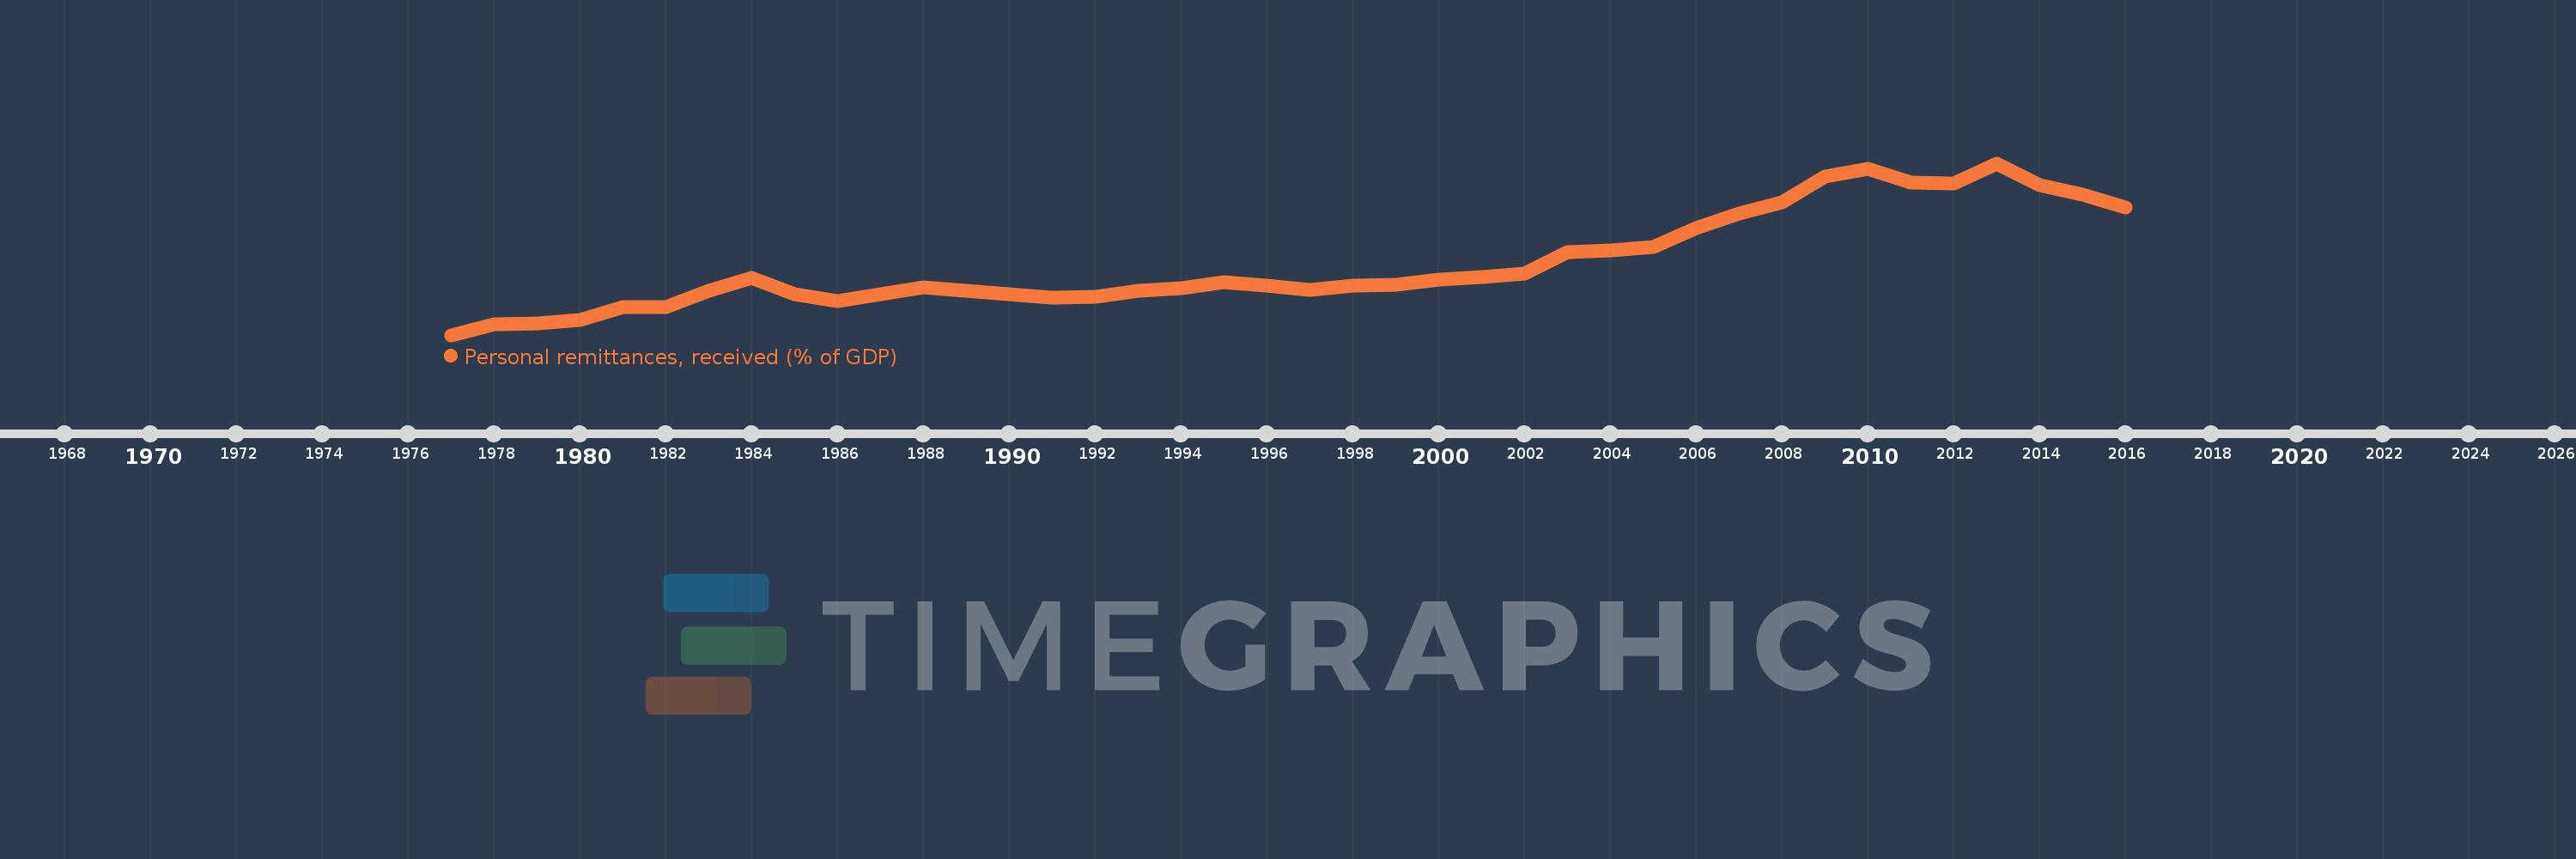
Personal remittances, received (% of GDP)
2016,2015,2014,2013,2012,2011,2010,2009,2008,2007,2006,2005,2004,2003,2002,2001,2000,1999,1998,1997,1996,1995,1994,1993,1992,1991,1990,1989,1988,1987,1986,1985,1984,1983,1982,1981,1980,1979,1978,1977
This statistics in other country:
AfghanistanAlbaniaAlgeriaAngolaAntigua and BarbudaArab WorldArgentinaArmeniaArubaAustraliaAustriaAzerbaijanBangladeshBarbadosBelarusBelgiumBelizeBeninBermudaBhutanBoliviaBosnia and HerzegovinaBotswanaBrazilBulgariaBurkina FasoBurundiCabo VerdeCambodiaCameroonCanadaCaribbean small statesCentral African RepublicCentral Europe and the BalticsChadChileChinaColombiaComorosCongo, Dem. Rep.Congo, Rep.Costa RicaCote d'IvoireCroatiaCyprusCzech RepublicDenmarkDjiboutiDominicaDominican RepublicEarly-demographic dividendEast Asia & PacificEast Asia & Pacific (excluding high income)East Asia & Pacific (IDA & IBRD countries)EcuadorEgypt, Arab Rep.El SalvadorEquatorial GuineaEritreaEstoniaEthiopiaEuro areaEurope & Central AsiaEurope & Central Asia (excluding high income)Europe & Central Asia (IDA & IBRD countries)European UnionFaroe IslandsFijiFinlandFragile and conflict affected situationsFranceGabonGambia, TheGeorgiaGermanyGhanaGreeceGrenadaGuatemalaGuineaGuinea-BissauGuyanaHaitiHeavily indebted poor countries (HIPC)High incomeHondurasHong Kong SAR, ChinaHungaryIBRD onlyIcelandIDA & IBRD totalIDA blendIDA onlyIDA totalIndiaIndonesiaIran, Islamic Rep.IraqIrelandIsraelItalyJamaicaJapanJordanKazakhstanKenyaKiribatiKorea, Rep.KosovoKuwaitKyrgyz RepublicLao PDRLate-demographic dividendLatin America & Caribbean Latin America & Caribbean (excluding high income)Latin America & the Caribbean (IDA & IBRD countries)LatviaLeast developed countries: UN classificationLebanonLesothoLiberiaLibyaLithuaniaLow & middle incomeLow incomeLower middle incomeLuxembourgMacao SAR, ChinaMacedonia, FYRMadagascarMalawiMalaysiaMaldivesMaliMaltaMarshall IslandsMauritaniaMauritiusMexicoMicronesia, Fed. Sts.Middle East & North AfricaMiddle East & North Africa (excluding high income)Middle East & North Africa (IDA & IBRD countries)Middle incomeMoldovaMongoliaMontenegroMoroccoMozambiqueMyanmarNamibiaNepalNetherlandsNew ZealandNicaraguaNigerNigeriaNorth AmericaNorwayOECD membersOmanOther small statesPacific island small statesPakistanPalauPanamaPapua New GuineaParaguayPeruPhilippinesPolandPortugalPost-demographic dividendPre-demographic dividendQatarRomaniaRussian FederationRwandaSamoaSao Tome and PrincipeSaudi ArabiaSenegalSerbiaSeychellesSierra LeoneSlovak RepublicSloveniaSmall statesSolomon IslandsSouth AfricaSouth AsiaSouth Asia (IDA & IBRD)South SudanSpainSri LankaSt. Kitts and NevisSt. LuciaSt. Vincent and the GrenadinesSub-Saharan Africa Sub-Saharan Africa (excluding high income)Sub-Saharan Africa (IDA & IBRD countries)SudanSurinameSwazilandSwedenSwitzerlandSyrian Arab RepublicTajikistanTanzaniaThailandTimor-LesteTogoTongaTrinidad and TobagoTunisiaTurkeyTurkmenistanTuvaluUgandaUkraineUnited KingdomUnited StatesUpper middle incomeUruguayUzbekistanVanuatuVenezuela, RBVietnamWest Bank and GazaWorldYemen, Rep.ZambiaZimbabwe Timeline:
This timeline shows a graph from 1977 to 2016 of Bangladesh. No data until 1976. Number of actual observations by date: 40.
Source name:
World Development Indicators
Source organization:
World Bank staff estimates based on IMF balance of payments data, and World Bank and OECD GDP estimates.
Categories, topics:
Economy & Growth, Financial Sector
Last updated:
apr 23, 2017
Indicators value changes by year
Maximum:
10.588
jan 1, 2013
At the date of observation
Value
Absolute change
Change from previous value
jan 1, 1977
0.185
+0.185
0.0%
jan 1, 1978
0.817
+0.632
340.71%
jan 1, 1979
0.869
+0.052
6.35%
jan 1, 1980
1.099
+0.23
26.5%
jan 1, 1981
1.867
+0.768
69.82%
jan 1, 1982
1.882
+0.015
0.78%
jan 1, 1983
2.842
+0.96
51.02%
jan 1, 1984
3.648
+0.806
28.37%
jan 1, 1985
2.647
-1.002
-27.46%
jan 1, 1986
2.255
-0.391
-14.78%
jan 1, 1987
2.647
+0.391
17.35%
jan 1, 1988
3.078
+0.431
16.28%
jan 1, 1989
2.873
-0.205
-6.65%
jan 1, 1990
2.634
-0.239
-8.34%
jan 1, 1991
2.465
-0.169
-6.4%
jan 1, 1992
2.485
+0.02
0.83%
jan 1, 1993
2.875
+0.39
15.7%
jan 1, 1994
3.037
+0.162
5.63%
jan 1, 1995
3.408
+0.371
12.21%
jan 1, 1996
3.167
-0.241
-7.07%
jan 1, 1997
2.896
-0.272
-8.58%
jan 1, 1998
3.164
+0.269
9.27%
jan 1, 1999
3.213
+0.049
1.55%
jan 1, 2000
3.524
+0.311
9.68%
jan 1, 2001
3.687
+0.163
4.61%
jan 1, 2002
3.898
+0.211
5.73%
jan 1, 2003
5.223
+1.325
33.99%
jan 1, 2004
5.305
+0.083
1.58%
jan 1, 2005
5.504
+0.199
3.75%
jan 1, 2006
6.685
+1.181
21.45%
jan 1, 2007
7.557
+0.872
13.04%
jan 1, 2008
8.243
+0.686
9.07%
jan 1, 2009
9.757
+1.514
18.37%
jan 1, 2010
10.266
+0.509
5.22%
jan 1, 2011
9.412
-0.854
-8.32%
jan 1, 2012
9.384
-0.028
-0.3%
jan 1, 2013
10.588
+1.204
12.83%
jan 1, 2014
9.245
-1.343
-12.68%
jan 1, 2015
8.669
-0.576
-6.23%
jan 1, 2016
7.888
-0.781
-9.01%
Ranking of countries by current statistics by years


Comments: