29
/
en
AIzaSyAYiBZKx7MnpbEhh9jyipgxe19OcubqV5w
April 1, 2024
257681
Switzerland
CHE
true
2
1
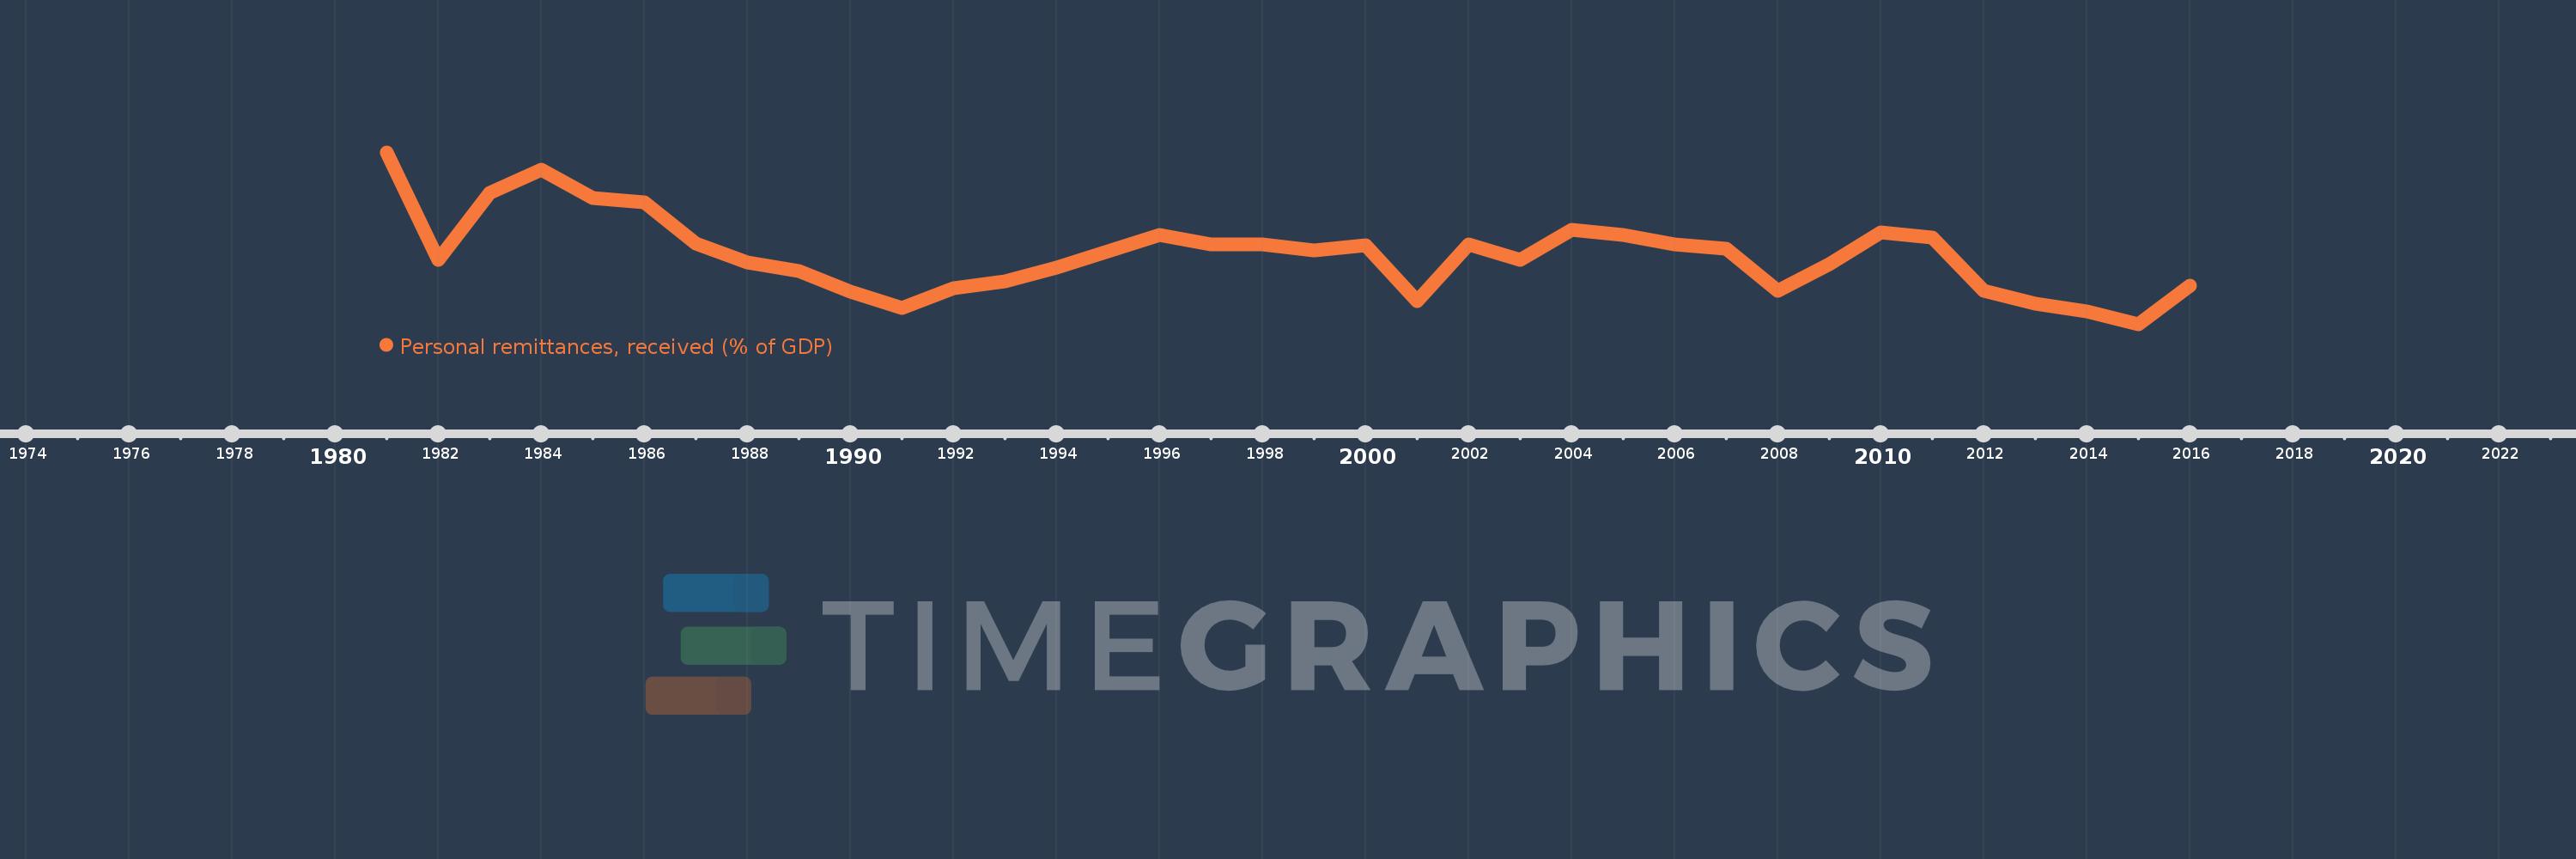
Personal remittances, received (% of GDP)
2016,2015,2014,2013,2012,2011,2010,2009,2008,2007,2006,2005,2004,2003,2002,2001,2000,1999,1998,1997,1996,1995,1994,1993,1992,1991,1990,1989,1988,1987,1986,1985,1984,1983,1982,1981
This statistics in other country:
AfghanistanAlbaniaAlgeriaAngolaAntigua and BarbudaArab WorldArgentinaArmeniaArubaAustraliaAustriaAzerbaijanBangladeshBarbadosBelarusBelgiumBelizeBeninBermudaBhutanBoliviaBosnia and HerzegovinaBotswanaBrazilBulgariaBurkina FasoBurundiCabo VerdeCambodiaCameroonCanadaCaribbean small statesCentral African RepublicCentral Europe and the BalticsChadChileChinaColombiaComorosCongo, Dem. Rep.Congo, Rep.Costa RicaCote d'IvoireCroatiaCyprusCzech RepublicDenmarkDjiboutiDominicaDominican RepublicEarly-demographic dividendEast Asia & PacificEast Asia & Pacific (excluding high income)East Asia & Pacific (IDA & IBRD countries)EcuadorEgypt, Arab Rep.El SalvadorEquatorial GuineaEritreaEstoniaEthiopiaEuro areaEurope & Central AsiaEurope & Central Asia (excluding high income)Europe & Central Asia (IDA & IBRD countries)European UnionFaroe IslandsFijiFinlandFragile and conflict affected situationsFranceGabonGambia, TheGeorgiaGermanyGhanaGreeceGrenadaGuatemalaGuineaGuinea-BissauGuyanaHaitiHeavily indebted poor countries (HIPC)High incomeHondurasHong Kong SAR, ChinaHungaryIBRD onlyIcelandIDA & IBRD totalIDA blendIDA onlyIDA totalIndiaIndonesiaIran, Islamic Rep.IraqIrelandIsraelItalyJamaicaJapanJordanKazakhstanKenyaKiribatiKorea, Rep.KosovoKuwaitKyrgyz RepublicLao PDRLate-demographic dividendLatin America & Caribbean Latin America & Caribbean (excluding high income)Latin America & the Caribbean (IDA & IBRD countries)LatviaLeast developed countries: UN classificationLebanonLesothoLiberiaLibyaLithuaniaLow & middle incomeLow incomeLower middle incomeLuxembourgMacao SAR, ChinaMacedonia, FYRMadagascarMalawiMalaysiaMaldivesMaliMaltaMarshall IslandsMauritaniaMauritiusMexicoMicronesia, Fed. Sts.Middle East & North AfricaMiddle East & North Africa (excluding high income)Middle East & North Africa (IDA & IBRD countries)Middle incomeMoldovaMongoliaMontenegroMoroccoMozambiqueMyanmarNamibiaNepalNetherlandsNew ZealandNicaraguaNigerNigeriaNorth AmericaNorwayOECD membersOmanOther small statesPacific island small statesPakistanPalauPanamaPapua New GuineaParaguayPeruPhilippinesPolandPortugalPost-demographic dividendPre-demographic dividendQatarRomaniaRussian FederationRwandaSamoaSao Tome and PrincipeSaudi ArabiaSenegalSerbiaSeychellesSierra LeoneSlovak RepublicSloveniaSmall statesSolomon IslandsSouth AfricaSouth AsiaSouth Asia (IDA & IBRD)South SudanSpainSri LankaSt. Kitts and NevisSt. LuciaSt. Vincent and the GrenadinesSub-Saharan Africa Sub-Saharan Africa (excluding high income)Sub-Saharan Africa (IDA & IBRD countries)SudanSurinameSwazilandSwedenSwitzerlandSyrian Arab RepublicTajikistanTanzaniaThailandTimor-LesteTogoTongaTrinidad and TobagoTunisiaTurkeyTurkmenistanTuvaluUgandaUkraineUnited KingdomUnited StatesUpper middle incomeUruguayUzbekistanVanuatuVenezuela, RBVietnamWest Bank and GazaWorldYemen, Rep.ZambiaZimbabwe Timeline:
This timeline shows a graph from 1981 to 2016 of Switzerland. No data until 1980. Number of actual observations by date: 36.
Source name:
World Development Indicators
Source organization:
World Bank staff estimates based on IMF balance of payments data, and World Bank and OECD GDP estimates.
Categories, topics:
Economy & Growth, Financial Sector
Last updated:
apr 23, 2017
Indicators value changes by year
At the date of observation
Value
Absolute change
Change from previous value
jan 1, 1981
0.513
+0.513
0.0%
jan 1, 1982
0.407
-0.105
-20.55%
jan 1, 1983
0.473
+0.066
16.09%
jan 1, 1984
0.496
+0.023
4.96%
jan 1, 1985
0.468
-0.029
-5.79%
jan 1, 1986
0.464
-0.004
-0.83%
jan 1, 1987
0.423
-0.041
-8.84%
jan 1, 1988
0.404
-0.019
-4.49%
jan 1, 1989
0.396
-0.008
-1.99%
jan 1, 1990
0.375
-0.021
-5.34%
jan 1, 1991
0.359
-0.016
-4.22%
jan 1, 1992
0.379
+0.02
5.64%
jan 1, 1993
0.385
+0.006
1.65%
jan 1, 1994
0.399
+0.014
3.59%
jan 1, 1995
0.415
+0.016
4.04%
jan 1, 1996
0.431
+0.016
3.81%
jan 1, 1997
0.422
-0.009
-2.15%
jan 1, 1998
0.422
0.0
-0.05%
jan 1, 1999
0.416
-0.006
-1.33%
jan 1, 2000
0.421
+0.005
1.31%
jan 1, 2001
0.366
-0.055
-13.09%
jan 1, 2002
0.422
+0.056
15.25%
jan 1, 2003
0.407
-0.015
-3.59%
jan 1, 2004
0.436
+0.029
7.05%
jan 1, 2005
0.431
-0.005
-1.11%
jan 1, 2006
0.422
-0.008
-1.95%
jan 1, 2007
0.418
-0.004
-0.98%
jan 1, 2008
0.376
-0.042
-10.08%
jan 1, 2009
0.402
+0.025
6.76%
jan 1, 2010
0.434
+0.032
8.08%
jan 1, 2011
0.429
-0.005
-1.11%
jan 1, 2012
0.376
-0.053
-12.44%
jan 1, 2013
0.363
-0.012
-3.31%
jan 1, 2014
0.356
-0.007
-2.04%
jan 1, 2015
0.343
-0.013
-3.54%
jan 1, 2016
0.381
+0.037
10.85%
Ranking of countries by current statistics by years


Comments: