29
/
en
AIzaSyAYiBZKx7MnpbEhh9jyipgxe19OcubqV5w
April 1, 2024
231518
Rwanda
RWA
true
2
1
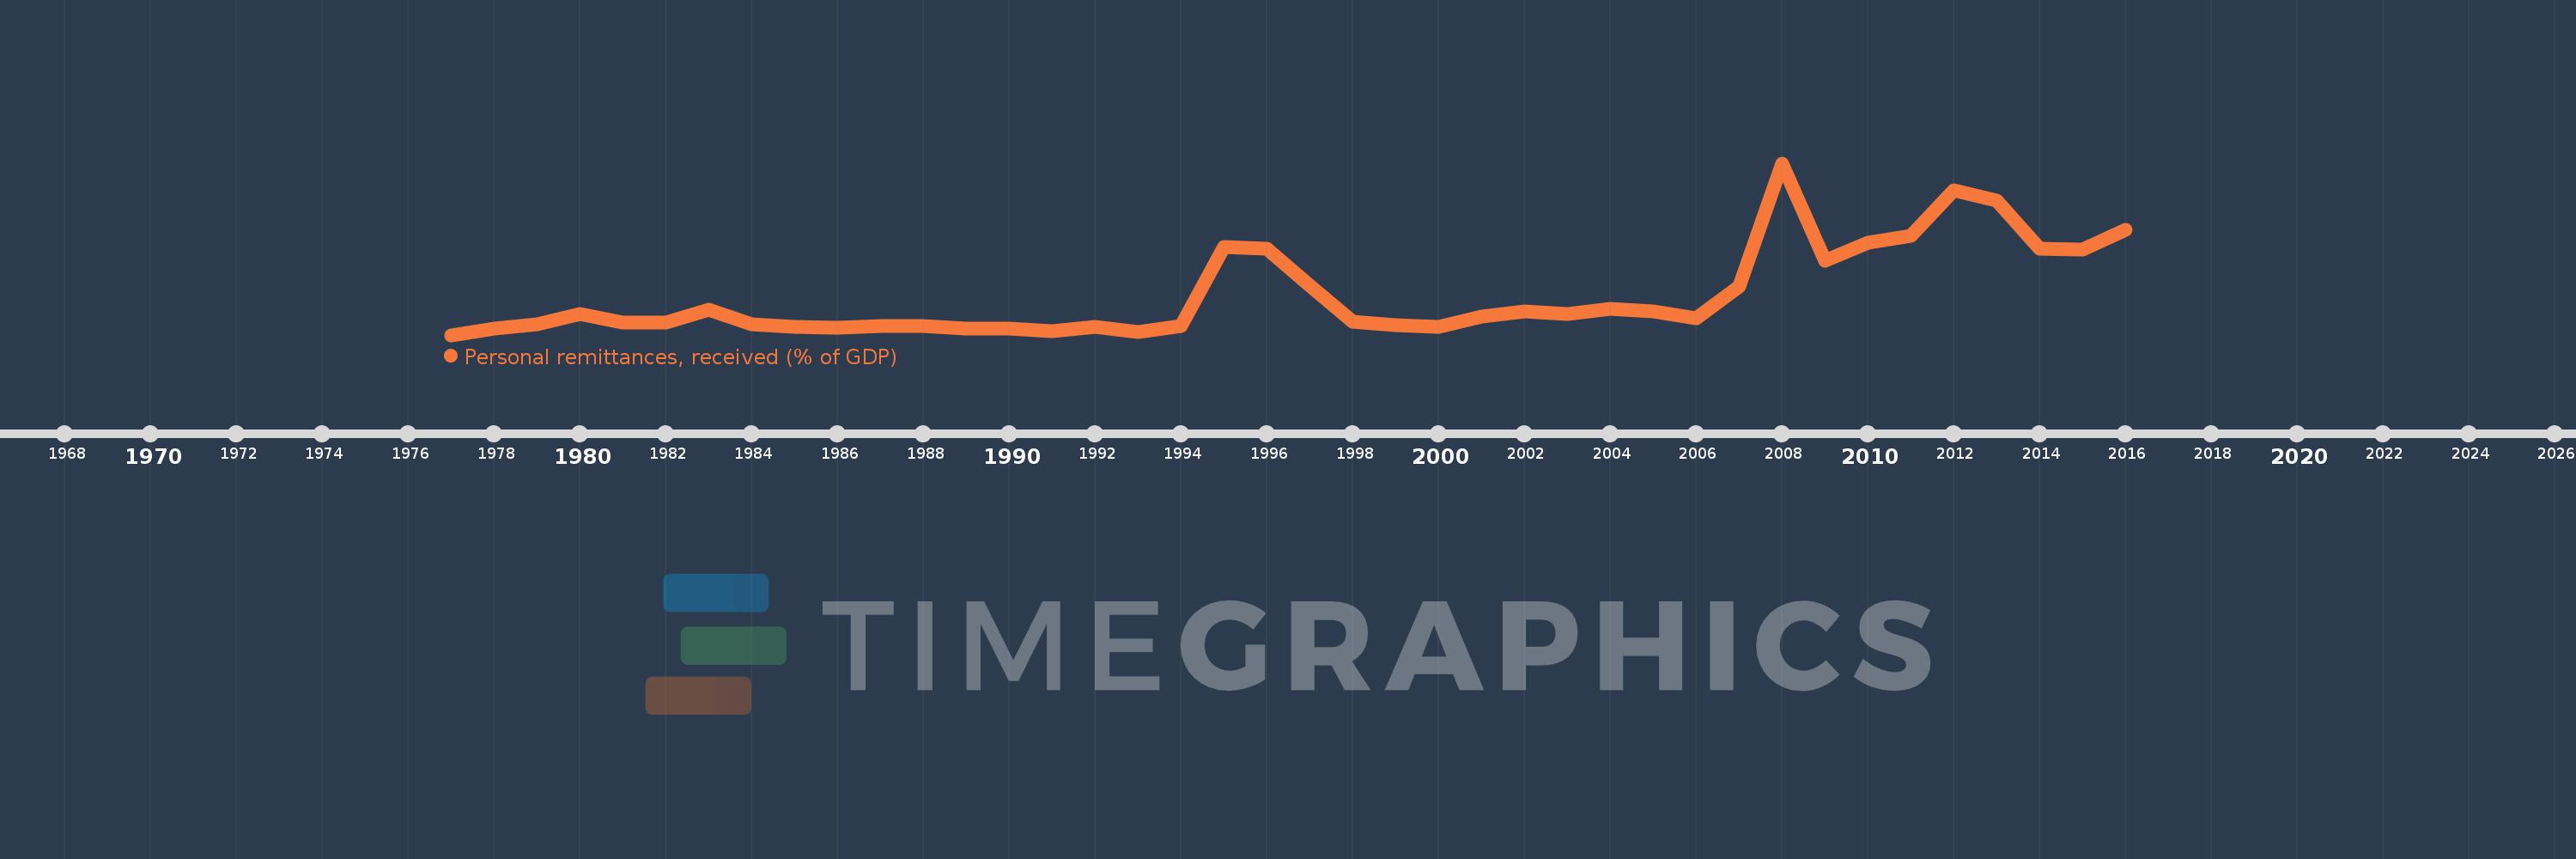
Personal remittances, received (% of GDP)
2016,2015,2014,2013,2012,2011,2010,2009,2008,2007,2006,2005,2004,2003,2002,2001,2000,1999,1998,1997,1996,1995,1994,1993,1992,1991,1990,1989,1988,1987,1986,1985,1984,1983,1982,1981,1980,1979,1978,1977
This statistics in other country:
AfghanistanAlbaniaAlgeriaAngolaAntigua and BarbudaArab WorldArgentinaArmeniaArubaAustraliaAustriaAzerbaijanBangladeshBarbadosBelarusBelgiumBelizeBeninBermudaBhutanBoliviaBosnia and HerzegovinaBotswanaBrazilBulgariaBurkina FasoBurundiCabo VerdeCambodiaCameroonCanadaCaribbean small statesCentral African RepublicCentral Europe and the BalticsChadChileChinaColombiaComorosCongo, Dem. Rep.Congo, Rep.Costa RicaCote d'IvoireCroatiaCyprusCzech RepublicDenmarkDjiboutiDominicaDominican RepublicEarly-demographic dividendEast Asia & PacificEast Asia & Pacific (excluding high income)East Asia & Pacific (IDA & IBRD countries)EcuadorEgypt, Arab Rep.El SalvadorEquatorial GuineaEritreaEstoniaEthiopiaEuro areaEurope & Central AsiaEurope & Central Asia (excluding high income)Europe & Central Asia (IDA & IBRD countries)European UnionFaroe IslandsFijiFinlandFragile and conflict affected situationsFranceGabonGambia, TheGeorgiaGermanyGhanaGreeceGrenadaGuatemalaGuineaGuinea-BissauGuyanaHaitiHeavily indebted poor countries (HIPC)High incomeHondurasHong Kong SAR, ChinaHungaryIBRD onlyIcelandIDA & IBRD totalIDA blendIDA onlyIDA totalIndiaIndonesiaIran, Islamic Rep.IraqIrelandIsraelItalyJamaicaJapanJordanKazakhstanKenyaKiribatiKorea, Rep.KosovoKuwaitKyrgyz RepublicLao PDRLate-demographic dividendLatin America & Caribbean Latin America & Caribbean (excluding high income)Latin America & the Caribbean (IDA & IBRD countries)LatviaLeast developed countries: UN classificationLebanonLesothoLiberiaLibyaLithuaniaLow & middle incomeLow incomeLower middle incomeLuxembourgMacao SAR, ChinaMacedonia, FYRMadagascarMalawiMalaysiaMaldivesMaliMaltaMarshall IslandsMauritaniaMauritiusMexicoMicronesia, Fed. Sts.Middle East & North AfricaMiddle East & North Africa (excluding high income)Middle East & North Africa (IDA & IBRD countries)Middle incomeMoldovaMongoliaMontenegroMoroccoMozambiqueMyanmarNamibiaNepalNetherlandsNew ZealandNicaraguaNigerNigeriaNorth AmericaNorwayOECD membersOmanOther small statesPacific island small statesPakistanPalauPanamaPapua New GuineaParaguayPeruPhilippinesPolandPortugalPost-demographic dividendPre-demographic dividendQatarRomaniaRussian FederationRwandaSamoaSao Tome and PrincipeSaudi ArabiaSenegalSerbiaSeychellesSierra LeoneSlovak RepublicSloveniaSmall statesSolomon IslandsSouth AfricaSouth AsiaSouth Asia (IDA & IBRD)South SudanSpainSri LankaSt. Kitts and NevisSt. LuciaSt. Vincent and the GrenadinesSub-Saharan Africa Sub-Saharan Africa (excluding high income)Sub-Saharan Africa (IDA & IBRD countries)SudanSurinameSwazilandSwedenSwitzerlandSyrian Arab RepublicTajikistanTanzaniaThailandTimor-LesteTogoTongaTrinidad and TobagoTunisiaTurkeyTurkmenistanTuvaluUgandaUkraineUnited KingdomUnited StatesUpper middle incomeUruguayUzbekistanVanuatuVenezuela, RBVietnamWest Bank and GazaWorldYemen, Rep.ZambiaZimbabwe Timeline:
This timeline shows a graph from 1977 to 2016 of Rwanda. No data until 1976. Number of actual observations by date: 40.
Source name:
World Development Indicators
Source organization:
World Bank staff estimates based on IMF balance of payments data, and World Bank and OECD GDP estimates.
Categories, topics:
Economy & Growth, Financial Sector
Last updated:
apr 23, 2017
Indicators value changes by year
At the date of observation
Value
Absolute change
Change from previous value
jan 1, 1977
0.039
+0.039
0.0%
jan 1, 1978
0.158
+0.119
306.68%
jan 1, 1979
0.239
+0.082
51.73%
jan 1, 1980
0.432
+0.192
80.29%
jan 1, 1981
0.269
-0.162
-37.55%
jan 1, 1982
0.277
+0.008
2.88%
jan 1, 1983
0.51
+0.233
83.99%
jan 1, 1984
0.232
-0.278
-54.5%
jan 1, 1985
0.185
-0.047
-20.11%
jan 1, 1986
0.167
-0.018
-9.95%
jan 1, 1987
0.207
+0.04
23.77%
jan 1, 1988
0.208
+0.001
0.49%
jan 1, 1989
0.159
-0.049
-23.48%
jan 1, 1990
0.164
+0.006
3.49%
jan 1, 1991
0.103
-0.061
-37.33%
jan 1, 1992
0.186
+0.083
80.05%
jan 1, 1993
0.091
-0.095
-51.02%
jan 1, 1994
0.199
+0.109
119.38%
jan 1, 1995
1.662
+1.463
733.76%
jan 1, 1996
1.633
-0.029
-1.76%
jan 1, 1997
0.954
-0.68
-41.61%
jan 1, 1998
0.283
-0.671
-70.34%
jan 1, 1999
0.215
-0.068
-23.98%
jan 1, 2000
0.183
-0.032
-15.11%
jan 1, 2001
0.382
+0.199
109.23%
jan 1, 2002
0.469
+0.087
22.73%
jan 1, 2003
0.43
-0.039
-8.3%
jan 1, 2004
0.521
+0.091
21.22%
jan 1, 2005
0.47
-0.051
-9.88%
jan 1, 2006
0.344
-0.126
-26.83%
jan 1, 2007
0.932
+0.589
171.31%
jan 1, 2008
3.218
+2.286
245.2%
jan 1, 2009
1.413
-1.804
-56.08%
jan 1, 2010
1.745
+0.331
23.42%
jan 1, 2011
1.868
+0.124
7.09%
jan 1, 2012
2.72
+0.852
45.58%
jan 1, 2013
2.527
-0.193
-7.11%
jan 1, 2014
1.637
-0.89
-35.23%
jan 1, 2015
1.62
-0.017
-1.01%
jan 1, 2016
1.994
+0.374
23.06%
Ranking of countries by current statistics by years


Comments: