29
/
en
AIzaSyAYiBZKx7MnpbEhh9jyipgxe19OcubqV5w
April 1, 2024
30198
Euro area
EMU
false
2
1
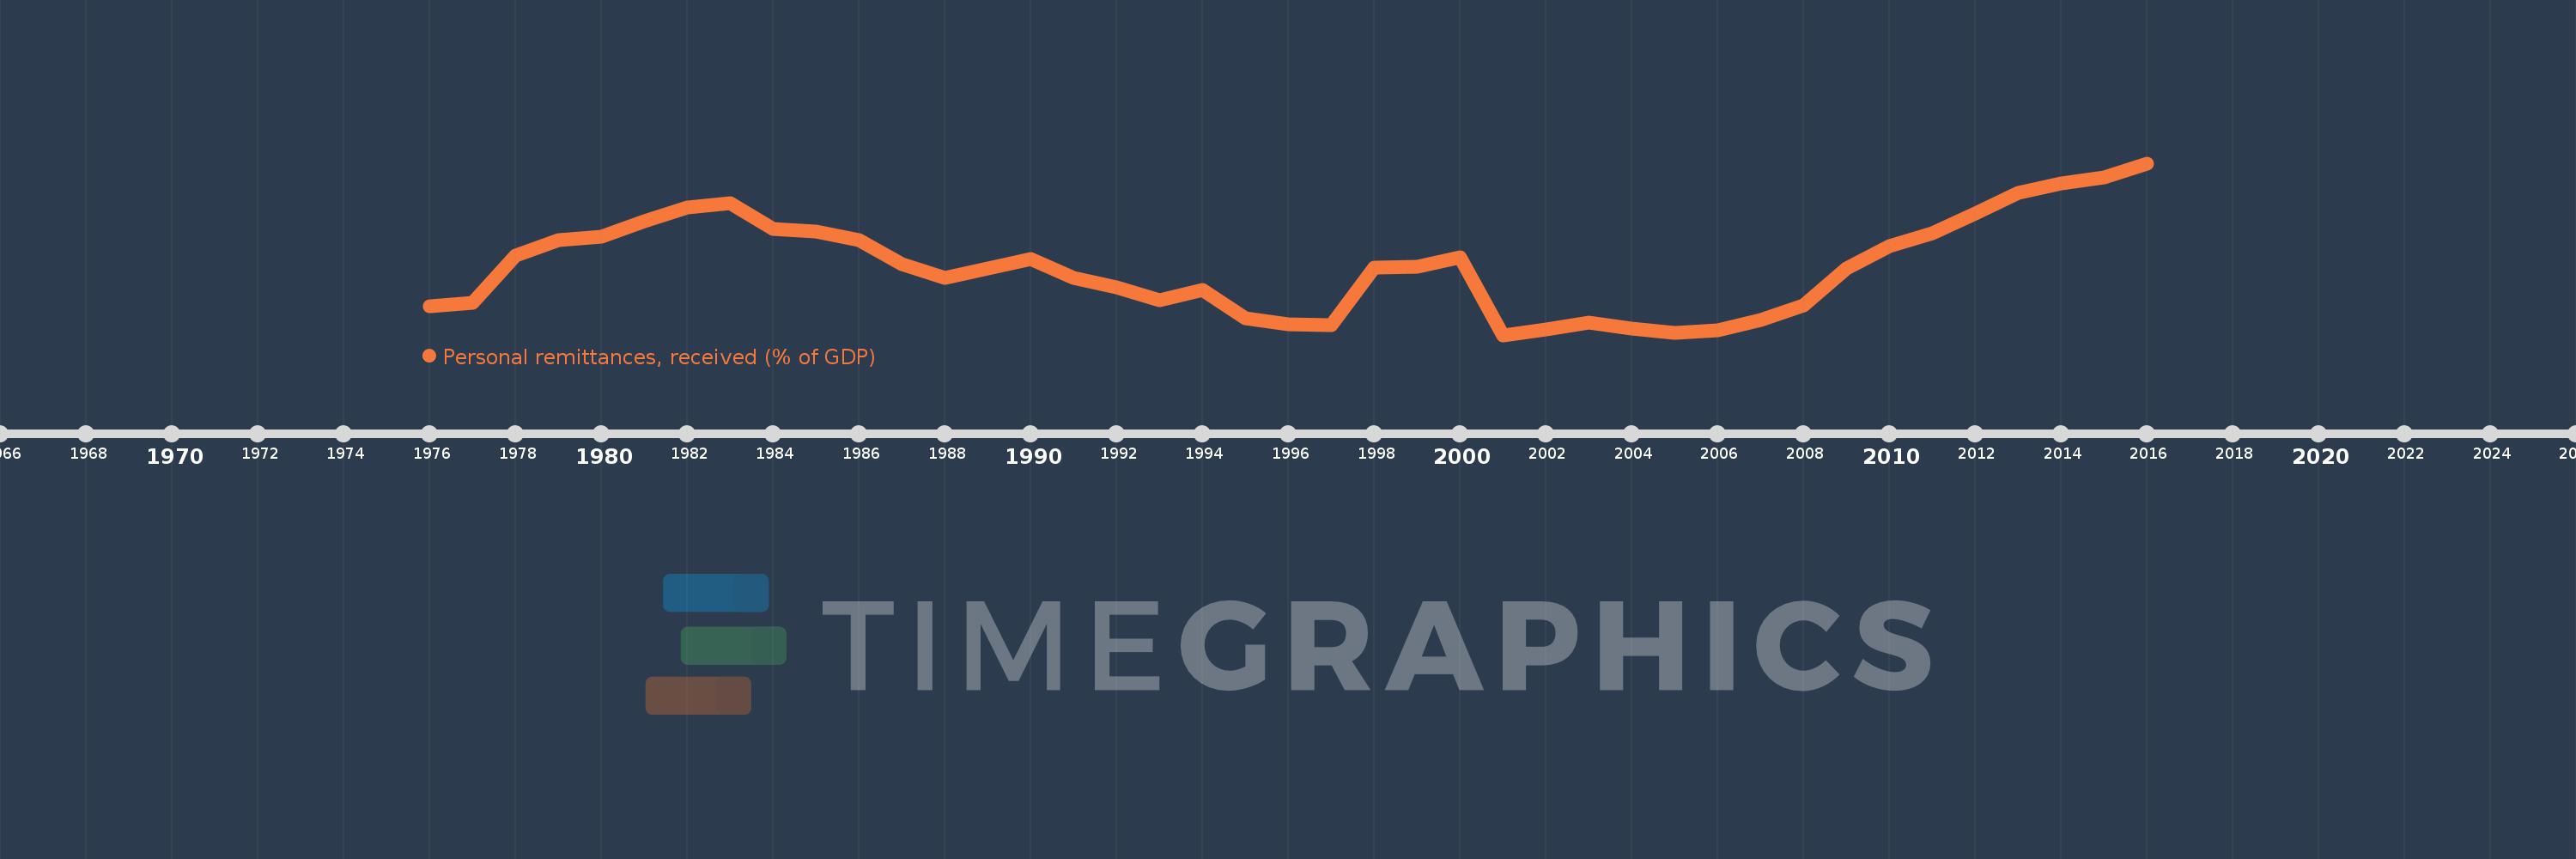
Personal remittances, received (% of GDP)
2016,2015,2014,2013,2012,2011,2010,2009,2008,2007,2006,2005,2004,2003,2002,2001,2000,1999,1998,1997,1996,1995,1994,1993,1992,1991,1990,1989,1988,1987,1986,1985,1984,1983,1982,1981,1980,1979,1978,1977,1976
This statistics in other country:
AfghanistanAlbaniaAlgeriaAngolaAntigua and BarbudaArab WorldArgentinaArmeniaArubaAustraliaAustriaAzerbaijanBangladeshBarbadosBelarusBelgiumBelizeBeninBermudaBhutanBoliviaBosnia and HerzegovinaBotswanaBrazilBulgariaBurkina FasoBurundiCabo VerdeCambodiaCameroonCanadaCaribbean small statesCentral African RepublicCentral Europe and the BalticsChadChileChinaColombiaComorosCongo, Dem. Rep.Congo, Rep.Costa RicaCote d'IvoireCroatiaCyprusCzech RepublicDenmarkDjiboutiDominicaDominican RepublicEarly-demographic dividendEast Asia & PacificEast Asia & Pacific (excluding high income)East Asia & Pacific (IDA & IBRD countries)EcuadorEgypt, Arab Rep.El SalvadorEquatorial GuineaEritreaEstoniaEthiopiaEuro areaEurope & Central AsiaEurope & Central Asia (excluding high income)Europe & Central Asia (IDA & IBRD countries)European UnionFaroe IslandsFijiFinlandFragile and conflict affected situationsFranceGabonGambia, TheGeorgiaGermanyGhanaGreeceGrenadaGuatemalaGuineaGuinea-BissauGuyanaHaitiHeavily indebted poor countries (HIPC)High incomeHondurasHong Kong SAR, ChinaHungaryIBRD onlyIcelandIDA & IBRD totalIDA blendIDA onlyIDA totalIndiaIndonesiaIran, Islamic Rep.IraqIrelandIsraelItalyJamaicaJapanJordanKazakhstanKenyaKiribatiKorea, Rep.KosovoKuwaitKyrgyz RepublicLao PDRLate-demographic dividendLatin America & Caribbean Latin America & Caribbean (excluding high income)Latin America & the Caribbean (IDA & IBRD countries)LatviaLeast developed countries: UN classificationLebanonLesothoLiberiaLibyaLithuaniaLow & middle incomeLow incomeLower middle incomeLuxembourgMacao SAR, ChinaMacedonia, FYRMadagascarMalawiMalaysiaMaldivesMaliMaltaMarshall IslandsMauritaniaMauritiusMexicoMicronesia, Fed. Sts.Middle East & North AfricaMiddle East & North Africa (excluding high income)Middle East & North Africa (IDA & IBRD countries)Middle incomeMoldovaMongoliaMontenegroMoroccoMozambiqueMyanmarNamibiaNepalNetherlandsNew ZealandNicaraguaNigerNigeriaNorth AmericaNorwayOECD membersOmanOther small statesPacific island small statesPakistanPalauPanamaPapua New GuineaParaguayPeruPhilippinesPolandPortugalPost-demographic dividendPre-demographic dividendQatarRomaniaRussian FederationRwandaSamoaSao Tome and PrincipeSaudi ArabiaSenegalSerbiaSeychellesSierra LeoneSlovak RepublicSloveniaSmall statesSolomon IslandsSouth AfricaSouth AsiaSouth Asia (IDA & IBRD)South SudanSpainSri LankaSt. Kitts and NevisSt. LuciaSt. Vincent and the GrenadinesSub-Saharan Africa Sub-Saharan Africa (excluding high income)Sub-Saharan Africa (IDA & IBRD countries)SudanSurinameSwazilandSwedenSwitzerlandSyrian Arab RepublicTajikistanTanzaniaThailandTimor-LesteTogoTongaTrinidad and TobagoTunisiaTurkeyTurkmenistanTuvaluUgandaUkraineUnited KingdomUnited StatesUpper middle incomeUruguayUzbekistanVanuatuVenezuela, RBVietnamWest Bank and GazaWorldYemen, Rep.ZambiaZimbabwe Timeline:
This timeline shows a graph from 1976 to 2016 of Euro area. No data until 1975. Number of actual observations by date: 41.
Source name:
World Development Indicators
Source organization:
World Bank staff estimates based on IMF balance of payments data, and World Bank and OECD GDP estimates.
Categories, topics:
Economy & Growth, Financial Sector
Last updated:
apr 23, 2017
Indicators value changes by year
At the date of observation
Value
Absolute change
Change from previous value
jan 1, 1976
0.436
+0.436
0.0%
jan 1, 1977
0.441
+0.005
1.23%
jan 1, 1978
0.512
+0.071
16.05%
jan 1, 1979
0.534
+0.022
4.3%
jan 1, 1980
0.54
+0.006
1.11%
jan 1, 1981
0.562
+0.022
4.04%
jan 1, 1982
0.583
+0.021
3.8%
jan 1, 1983
0.589
+0.006
1.04%
jan 1, 1984
0.551
-0.039
-6.55%
jan 1, 1985
0.547
-0.004
-0.65%
jan 1, 1986
0.534
-0.014
-2.47%
jan 1, 1987
0.499
-0.034
-6.42%
jan 1, 1988
0.478
-0.021
-4.28%
jan 1, 1989
0.492
+0.014
2.87%
jan 1, 1990
0.506
+0.015
2.98%
jan 1, 1991
0.479
-0.027
-5.3%
jan 1, 1992
0.464
-0.015
-3.12%
jan 1, 1993
0.445
-0.02
-4.25%
jan 1, 1994
0.461
+0.016
3.61%
jan 1, 1995
0.419
-0.042
-9.02%
jan 1, 1996
0.41
-0.009
-2.12%
jan 1, 1997
0.409
-0.001
-0.27%
jan 1, 1998
0.494
+0.085
20.74%
jan 1, 1999
0.495
+0.001
0.21%
jan 1, 2000
0.509
+0.014
2.79%
jan 1, 2001
0.394
-0.115
-22.53%
jan 1, 2002
0.402
+0.007
1.85%
jan 1, 2003
0.412
+0.011
2.62%
jan 1, 2004
0.404
-0.008
-2.02%
jan 1, 2005
0.397
-0.007
-1.68%
jan 1, 2006
0.401
+0.004
0.9%
jan 1, 2007
0.416
+0.016
3.98%
jan 1, 2008
0.438
+0.021
5.08%
jan 1, 2009
0.493
+0.056
12.75%
jan 1, 2010
0.525
+0.031
6.36%
jan 1, 2011
0.545
+0.02
3.76%
jan 1, 2012
0.574
+0.029
5.4%
jan 1, 2013
0.604
+0.03
5.18%
jan 1, 2014
0.618
+0.015
2.45%
jan 1, 2015
0.627
+0.009
1.39%
jan 1, 2016
0.648
+0.021
3.33%
Ranking of countries by current statistics by years


Comments: