29
/
en
AIzaSyAYiBZKx7MnpbEhh9jyipgxe19OcubqV5w
April 1, 2024
80065
Barbados
BRB
true
2
1
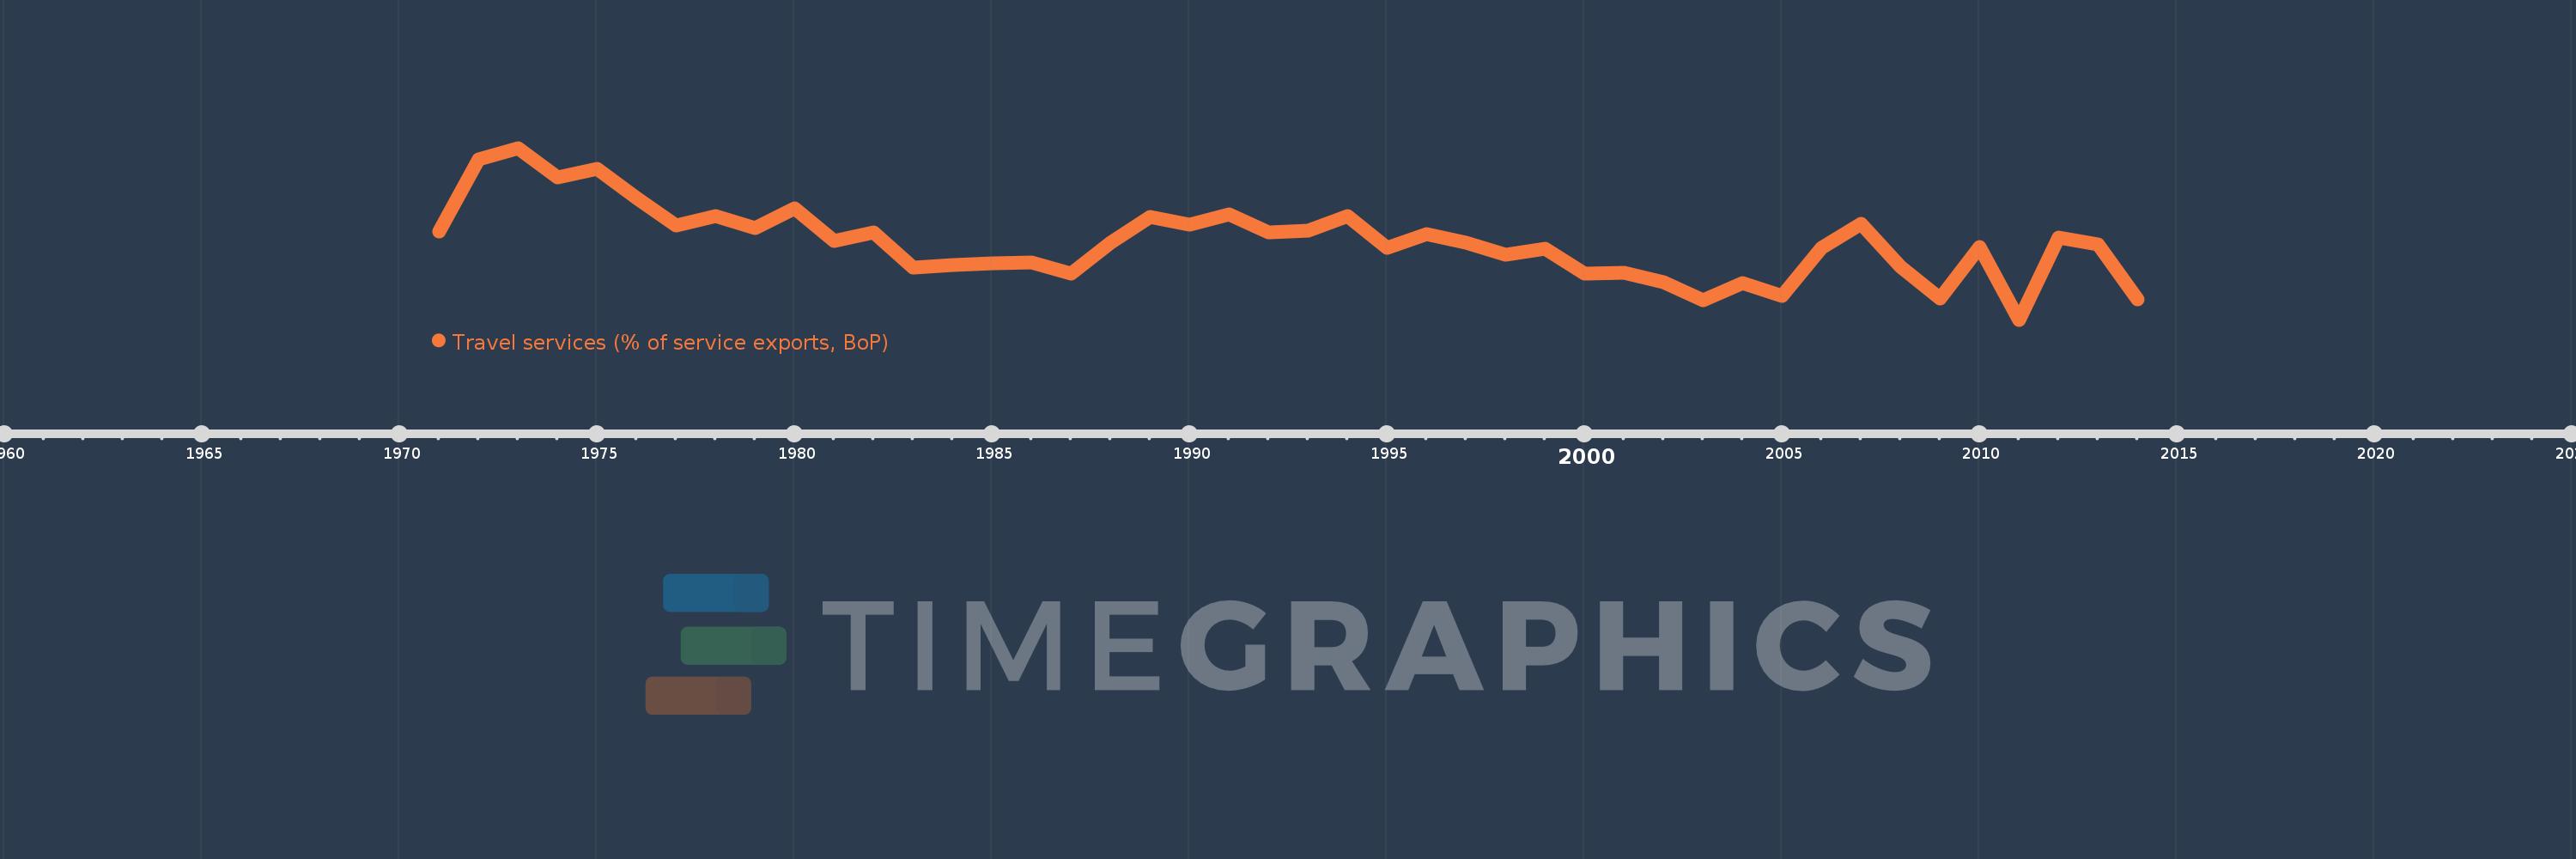
Travel services (% of service exports, BoP)
2014,2013,2012,2011,2010,2009,2008,2007,2006,2005,2004,2003,2002,2001,2000,1999,1998,1997,1996,1995,1994,1993,1992,1991,1990,1989,1988,1987,1986,1985,1984,1983,1982,1981,1980,1979,1978,1977,1976,1975,1974,1973,1972,1971
This statistics in other country:
AfghanistanAlbaniaAlgeriaAngolaAntigua and BarbudaArab WorldArgentinaArmeniaArubaAustraliaAustriaAzerbaijanBahamas, TheBahrainBangladeshBarbadosBelarusBelgiumBelizeBeninBermudaBhutanBoliviaBosnia and HerzegovinaBotswanaBrazilBrunei DarussalamBulgariaBurkina FasoBurundiCabo VerdeCambodiaCameroonCanadaCaribbean small statesCentral African RepublicCentral Europe and the BalticsChadChileChinaColombiaComorosCongo, Dem. Rep.Congo, Rep.Costa RicaCote d'IvoireCroatiaCuracaoCyprusCzech RepublicDenmarkDjiboutiDominicaDominican RepublicEarly-demographic dividendEast Asia & PacificEast Asia & Pacific (excluding high income)East Asia & Pacific (IDA & IBRD countries)EcuadorEgypt, Arab Rep.El SalvadorEritreaEstoniaEthiopiaEuro areaEurope & Central AsiaEurope & Central Asia (excluding high income)Europe & Central Asia (IDA & IBRD countries)European UnionFaroe IslandsFijiFinlandFragile and conflict affected situationsFranceFrench PolynesiaGabonGambia, TheGeorgiaGermanyGhanaGreeceGrenadaGuatemalaGuineaGuinea-BissauGuyanaHaitiHeavily indebted poor countries (HIPC)High incomeHondurasHong Kong SAR, ChinaHungaryIBRD onlyIcelandIDA & IBRD totalIDA onlyIDA totalIndiaIndonesiaIran, Islamic Rep.IraqIrelandIsraelItalyJamaicaJapanJordanKazakhstanKenyaKiribatiKorea, Rep.KosovoKuwaitKyrgyz RepublicLao PDRLate-demographic dividendLatin America & Caribbean Latin America & Caribbean (excluding high income)Latin America & the Caribbean (IDA & IBRD countries)LatviaLeast developed countries: UN classificationLebanonLesothoLiberiaLibyaLithuaniaLow & middle incomeLow incomeLower middle incomeLuxembourgMacao SAR, ChinaMacedonia, FYRMadagascarMalawiMalaysiaMaldivesMaliMaltaMarshall IslandsMauritaniaMauritiusMexicoMicronesia, Fed. Sts.Middle East & North Africa (excluding high income)Middle East & North Africa (IDA & IBRD countries)Middle incomeMoldovaMongoliaMontenegroMoroccoMozambiqueMyanmarNamibiaNepalNetherlandsNew CaledoniaNew ZealandNicaraguaNigerNigeriaNorth AmericaNorwayOECD membersOmanOther small statesPacific island small statesPakistanPalauPanamaPapua New GuineaParaguayPeruPhilippinesPolandPortugalPost-demographic dividendPre-demographic dividendQatarRomaniaRussian FederationRwandaSamoaSao Tome and PrincipeSaudi ArabiaSenegalSerbiaSeychellesSierra LeoneSingaporeSint Maarten (Dutch part)Slovak RepublicSloveniaSmall statesSolomon IslandsSouth AfricaSouth AsiaSouth Asia (IDA & IBRD)South SudanSpainSri LankaSt. Kitts and NevisSt. LuciaSt. Vincent and the GrenadinesSub-Saharan Africa Sub-Saharan Africa (excluding high income)Sub-Saharan Africa (IDA & IBRD countries)SudanSurinameSwazilandSwedenSwitzerlandSyrian Arab RepublicTajikistanTanzaniaThailandTimor-LesteTogoTongaTrinidad and TobagoTunisiaTurkeyTuvaluUgandaUkraineUnited KingdomUnited StatesUpper middle incomeUruguayVanuatuVenezuela, RBWest Bank and GazaWorldYemen, Rep.ZambiaZimbabwe Timeline:
This timeline shows a graph from 1971 to 2014 of Barbados. No data until 1970. Number of actual observations by date: 44.
Source name:
World Development Indicators
Source organization:
International Monetary Fund, Balance of Payments Statistics Yearbook and data files.
Categories, topics:
Economy & Growth, Trade
Last updated:
apr 23, 2017
Indicators value changes by year
Minimum:
65.378
jan 1, 2011
Maximum:
85.491
jan 1, 1973
At the date of observation
Value
Absolute change
Change from previous value
jan 1, 1971
75.704
+75.704
0.0%
jan 1, 1972
84.111
+8.408
11.11%
jan 1, 1973
85.491
+1.379
1.64%
jan 1, 1974
82.025
-3.466
-4.05%
jan 1, 1975
83.077
+1.052
1.28%
jan 1, 1976
79.643
-3.434
-4.13%
jan 1, 1977
76.363
-3.28
-4.12%
jan 1, 1978
77.565
+1.202
1.57%
jan 1, 1979
76.085
-1.481
-1.91%
jan 1, 1980
78.39
+2.305
3.03%
jan 1, 1981
74.569
-3.82
-4.87%
jan 1, 1982
75.632
+1.063
1.43%
jan 1, 1983
71.464
-4.168
-5.51%
jan 1, 1984
71.812
+0.347
0.49%
jan 1, 1985
71.985
+0.174
0.24%
jan 1, 1986
72.042
+0.057
0.08%
jan 1, 1987
70.729
-1.314
-1.82%
jan 1, 1988
74.362
+3.633
5.14%
jan 1, 1989
77.38
+3.018
4.06%
jan 1, 1990
76.552
-0.827
-1.07%
jan 1, 1991
77.747
+1.195
1.56%
jan 1, 1992
75.607
-2.14
-2.75%
jan 1, 1993
75.759
+0.152
0.2%
jan 1, 1994
77.469
+1.709
2.26%
jan 1, 1995
73.792
-3.676
-4.75%
jan 1, 1996
75.381
+1.589
2.15%
jan 1, 1997
74.377
-1.003
-1.33%
jan 1, 1998
72.944
-1.433
-1.93%
jan 1, 1999
73.683
+0.739
1.01%
jan 1, 2000
70.812
-2.871
-3.9%
jan 1, 2001
70.852
+0.04
0.06%
jan 1, 2002
69.742
-1.11
-1.57%
jan 1, 2003
67.633
-2.109
-3.02%
jan 1, 2004
69.641
+2.008
2.97%
jan 1, 2005
68.174
-1.467
-2.11%
jan 1, 2006
73.818
+5.644
8.28%
jan 1, 2007
76.592
+2.773
3.76%
jan 1, 2008
71.587
-5.005
-6.53%
jan 1, 2009
67.889
-3.698
-5.17%
jan 1, 2010
73.941
+6.053
8.92%
jan 1, 2011
65.378
-8.563
-11.58%
jan 1, 2012
75.046
+9.668
14.79%
jan 1, 2013
74.171
-0.875
-1.17%
jan 1, 2014
67.804
-6.367
-8.58%
Ranking of countries by current statistics by years


Comments: