29
/
en
AIzaSyAYiBZKx7MnpbEhh9jyipgxe19OcubqV5w
April 1, 2024
188599
Malaysia
MYS
true
2
1
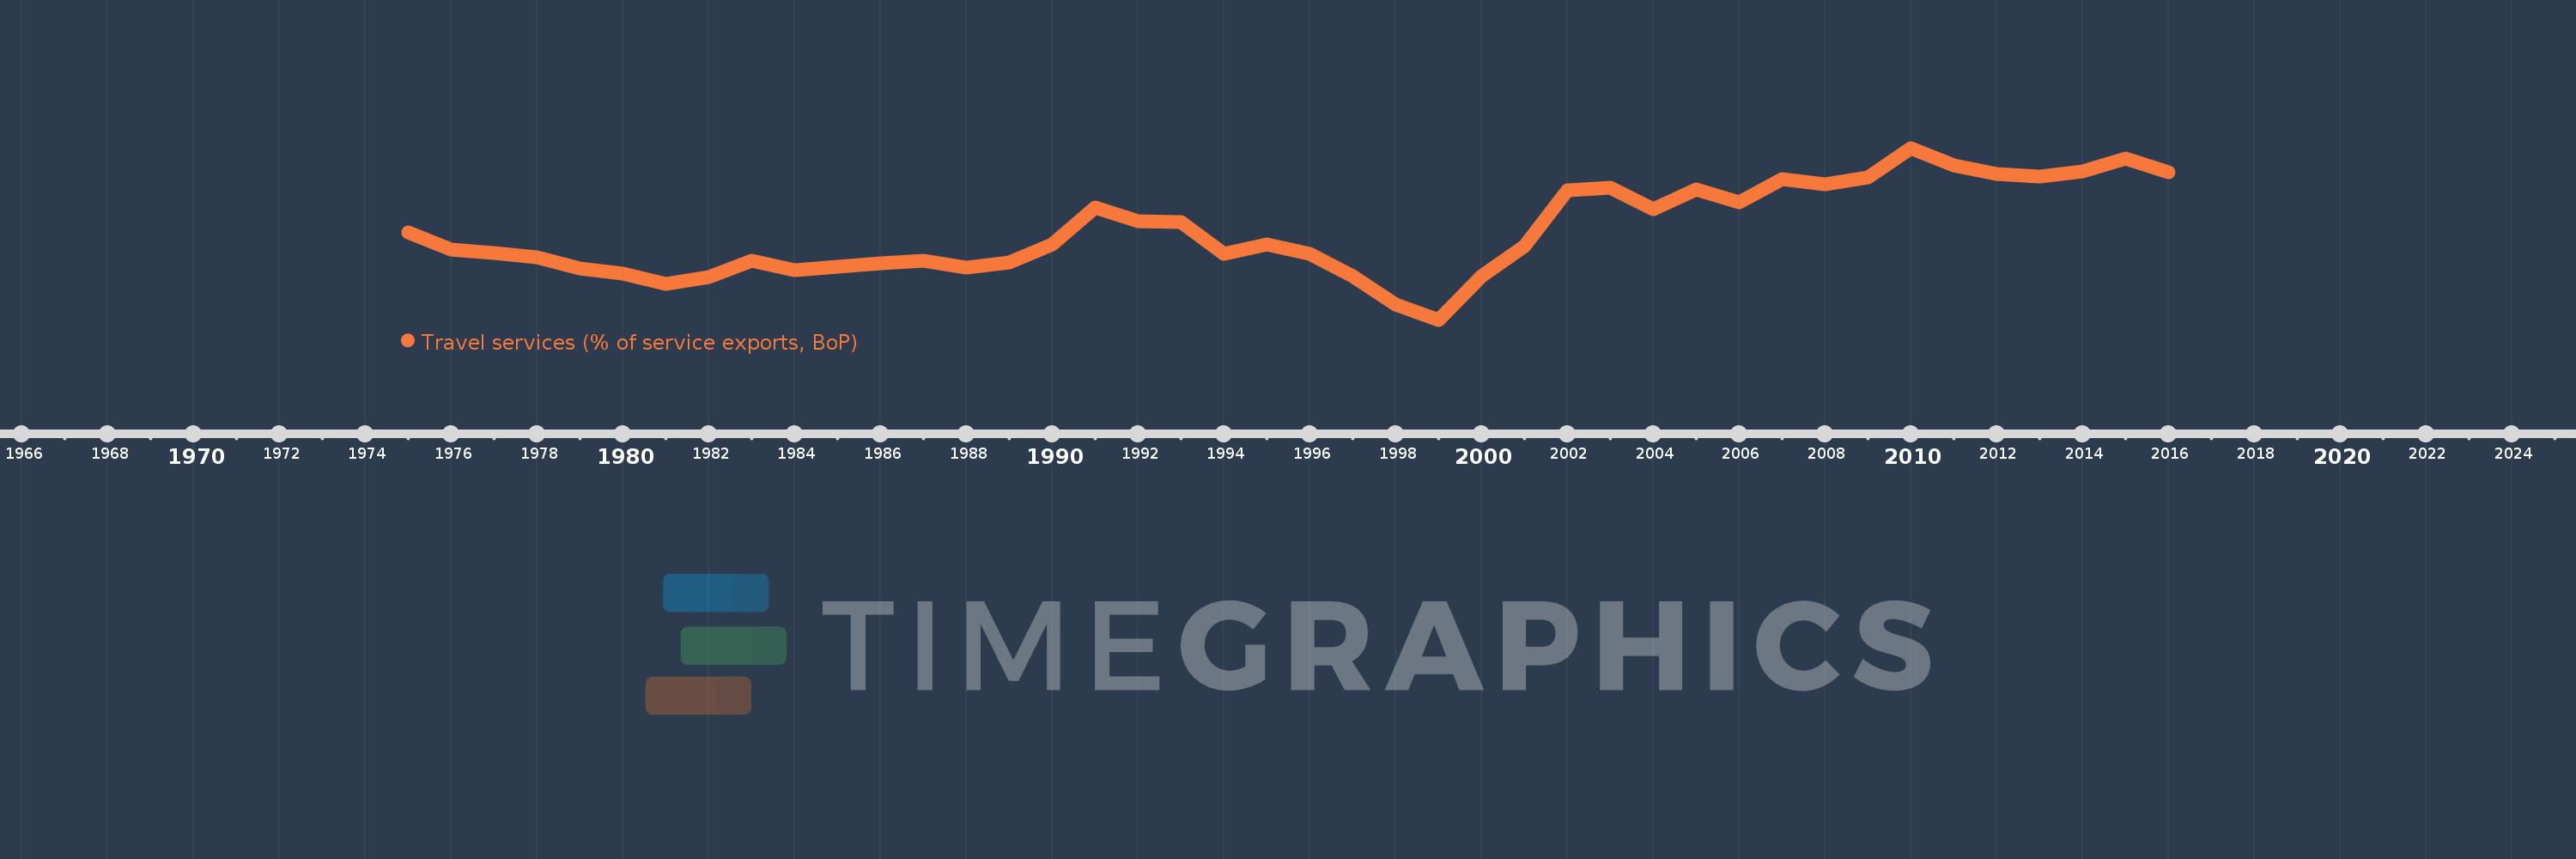
Travel services (% of service exports, BoP)
2016,2015,2014,2013,2012,2011,2010,2009,2008,2007,2006,2005,2004,2003,2002,2001,2000,1999,1998,1997,1996,1995,1994,1993,1992,1991,1990,1989,1988,1987,1986,1985,1984,1983,1982,1981,1980,1979,1978,1977,1976,1975
This statistics in other country:
AfghanistanAlbaniaAlgeriaAngolaAntigua and BarbudaArab WorldArgentinaArmeniaArubaAustraliaAustriaAzerbaijanBahamas, TheBahrainBangladeshBarbadosBelarusBelgiumBelizeBeninBermudaBhutanBoliviaBosnia and HerzegovinaBotswanaBrazilBrunei DarussalamBulgariaBurkina FasoBurundiCabo VerdeCambodiaCameroonCanadaCaribbean small statesCentral African RepublicCentral Europe and the BalticsChadChileChinaColombiaComorosCongo, Dem. Rep.Congo, Rep.Costa RicaCote d'IvoireCroatiaCuracaoCyprusCzech RepublicDenmarkDjiboutiDominicaDominican RepublicEarly-demographic dividendEast Asia & PacificEast Asia & Pacific (excluding high income)East Asia & Pacific (IDA & IBRD countries)EcuadorEgypt, Arab Rep.El SalvadorEritreaEstoniaEthiopiaEuro areaEurope & Central AsiaEurope & Central Asia (excluding high income)Europe & Central Asia (IDA & IBRD countries)European UnionFaroe IslandsFijiFinlandFragile and conflict affected situationsFranceFrench PolynesiaGabonGambia, TheGeorgiaGermanyGhanaGreeceGrenadaGuatemalaGuineaGuinea-BissauGuyanaHaitiHeavily indebted poor countries (HIPC)High incomeHondurasHong Kong SAR, ChinaHungaryIBRD onlyIcelandIDA & IBRD totalIDA onlyIDA totalIndiaIndonesiaIran, Islamic Rep.IraqIrelandIsraelItalyJamaicaJapanJordanKazakhstanKenyaKiribatiKorea, Rep.KosovoKuwaitKyrgyz RepublicLao PDRLate-demographic dividendLatin America & Caribbean Latin America & Caribbean (excluding high income)Latin America & the Caribbean (IDA & IBRD countries)LatviaLeast developed countries: UN classificationLebanonLesothoLiberiaLibyaLithuaniaLow & middle incomeLow incomeLower middle incomeLuxembourgMacao SAR, ChinaMacedonia, FYRMadagascarMalawiMalaysiaMaldivesMaliMaltaMarshall IslandsMauritaniaMauritiusMexicoMicronesia, Fed. Sts.Middle East & North Africa (excluding high income)Middle East & North Africa (IDA & IBRD countries)Middle incomeMoldovaMongoliaMontenegroMoroccoMozambiqueMyanmarNamibiaNepalNetherlandsNew CaledoniaNew ZealandNicaraguaNigerNigeriaNorth AmericaNorwayOECD membersOmanOther small statesPacific island small statesPakistanPalauPanamaPapua New GuineaParaguayPeruPhilippinesPolandPortugalPost-demographic dividendPre-demographic dividendQatarRomaniaRussian FederationRwandaSamoaSao Tome and PrincipeSaudi ArabiaSenegalSerbiaSeychellesSierra LeoneSingaporeSint Maarten (Dutch part)Slovak RepublicSloveniaSmall statesSolomon IslandsSouth AfricaSouth AsiaSouth Asia (IDA & IBRD)South SudanSpainSri LankaSt. Kitts and NevisSt. LuciaSt. Vincent and the GrenadinesSub-Saharan Africa Sub-Saharan Africa (excluding high income)Sub-Saharan Africa (IDA & IBRD countries)SudanSurinameSwazilandSwedenSwitzerlandSyrian Arab RepublicTajikistanTanzaniaThailandTimor-LesteTogoTongaTrinidad and TobagoTunisiaTurkeyTuvaluUgandaUkraineUnited KingdomUnited StatesUpper middle incomeUruguayVanuatuVenezuela, RBWest Bank and GazaWorldYemen, Rep.ZambiaZimbabwe Timeline:
This timeline shows a graph from 1975 to 2016 of Malaysia. No data until 1974. Number of actual observations by date: 42.
Source name:
World Development Indicators
Source organization:
International Monetary Fund, Balance of Payments Statistics Yearbook and data files.
Categories, topics:
Economy & Growth, Trade
Last updated:
apr 23, 2017
Indicators value changes by year
Maximum:
55.838
jan 1, 2010
At the date of observation
Value
Absolute change
Change from previous value
jan 1, 1975
38.504
+38.504
0.0%
jan 1, 1976
35.066
-3.438
-8.93%
jan 1, 1977
34.387
-0.679
-1.94%
jan 1, 1978
33.499
-0.889
-2.58%
jan 1, 1979
31.155
-2.343
-7.0%
jan 1, 1980
30.075
-1.08
-3.47%
jan 1, 1981
27.964
-2.111
-7.02%
jan 1, 1982
29.396
+1.432
5.12%
jan 1, 1983
32.782
+3.386
11.52%
jan 1, 1984
30.859
-1.923
-5.87%
jan 1, 1985
31.464
+0.605
1.96%
jan 1, 1986
32.147
+0.683
2.17%
jan 1, 1987
32.688
+0.542
1.68%
jan 1, 1988
31.401
-1.288
-3.94%
jan 1, 1989
32.36
+0.959
3.05%
jan 1, 1990
36.103
+3.743
11.57%
jan 1, 1991
43.639
+7.536
20.87%
jan 1, 1992
40.765
-2.874
-6.59%
jan 1, 1993
40.648
-0.116
-0.29%
jan 1, 1994
34.161
-6.487
-15.96%
jan 1, 1995
36.123
+1.962
5.74%
jan 1, 1996
34.208
-1.916
-5.3%
jan 1, 1997
29.58
-4.628
-13.53%
jan 1, 1998
23.784
-5.796
-19.59%
jan 1, 1999
20.67
-3.114
-13.09%
jan 1, 2000
29.667
+8.997
43.53%
jan 1, 2001
35.678
+6.011
20.26%
jan 1, 2002
47.102
+11.424
32.02%
jan 1, 2003
47.712
+0.61
1.3%
jan 1, 2004
43.259
-4.453
-9.33%
jan 1, 2005
47.385
+4.125
9.54%
jan 1, 2006
44.791
-2.594
-5.47%
jan 1, 2007
49.462
+4.671
10.43%
jan 1, 2008
48.321
-1.141
-2.31%
jan 1, 2009
49.732
+1.411
2.92%
jan 1, 2010
55.838
+6.106
12.28%
jan 1, 2011
52.348
-3.49
-6.25%
jan 1, 2012
50.587
-1.762
-3.36%
jan 1, 2013
49.902
-0.685
-1.35%
jan 1, 2014
51.068
+1.166
2.34%
jan 1, 2015
53.737
+2.669
5.23%
jan 1, 2016
50.793
-2.944
-5.48%
Ranking of countries by current statistics by years


Comments: