29
/
en
AIzaSyAYiBZKx7MnpbEhh9jyipgxe19OcubqV5w
April 1, 2024
265394
Togo
TGO
true
2
1
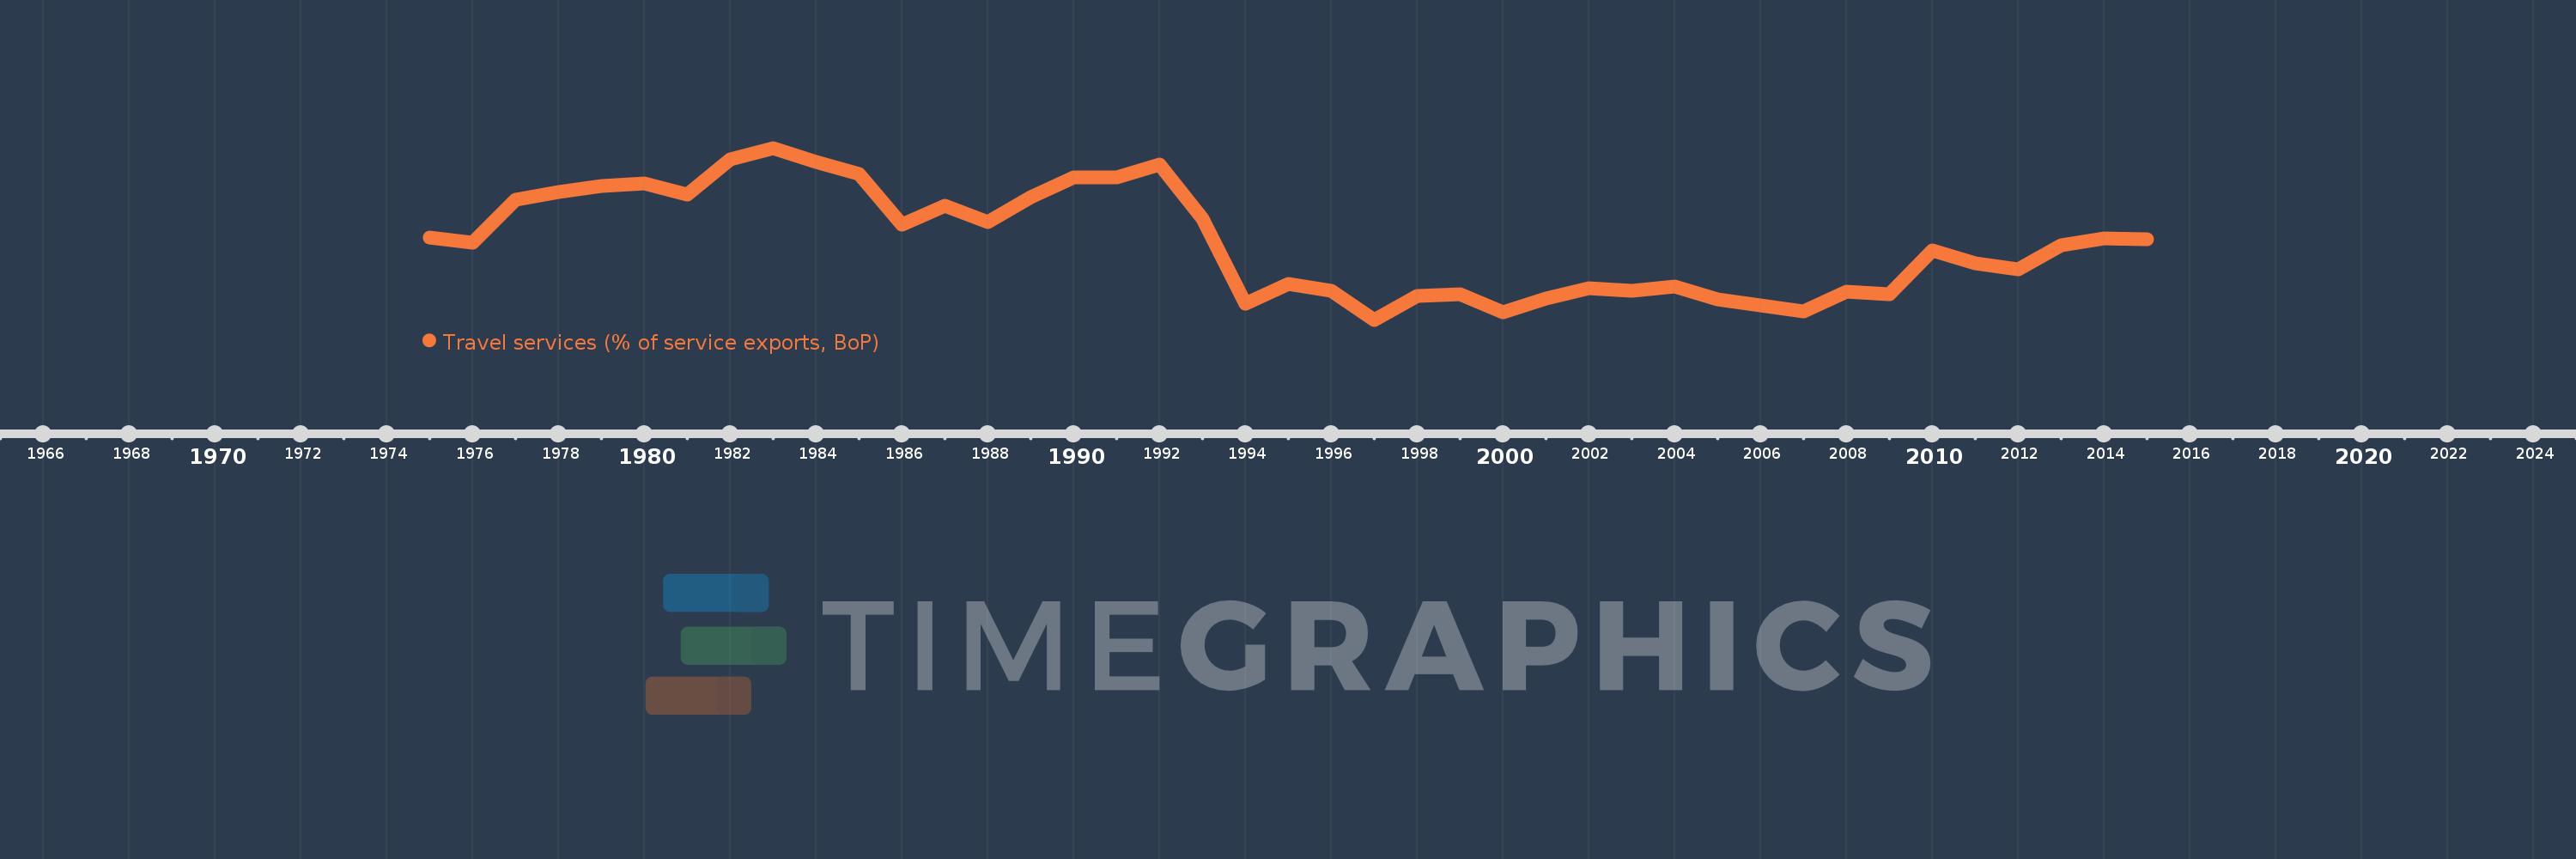
Travel services (% of service exports, BoP)
2015,2014,2013,2012,2011,2010,2009,2008,2007,2006,2005,2004,2003,2002,2001,2000,1999,1998,1997,1996,1995,1994,1993,1992,1991,1990,1989,1988,1987,1986,1985,1984,1983,1982,1981,1980,1979,1978,1977,1976,1975
This statistics in other country:
AfghanistanAlbaniaAlgeriaAngolaAntigua and BarbudaArab WorldArgentinaArmeniaArubaAustraliaAustriaAzerbaijanBahamas, TheBahrainBangladeshBarbadosBelarusBelgiumBelizeBeninBermudaBhutanBoliviaBosnia and HerzegovinaBotswanaBrazilBrunei DarussalamBulgariaBurkina FasoBurundiCabo VerdeCambodiaCameroonCanadaCaribbean small statesCentral African RepublicCentral Europe and the BalticsChadChileChinaColombiaComorosCongo, Dem. Rep.Congo, Rep.Costa RicaCote d'IvoireCroatiaCuracaoCyprusCzech RepublicDenmarkDjiboutiDominicaDominican RepublicEarly-demographic dividendEast Asia & PacificEast Asia & Pacific (excluding high income)East Asia & Pacific (IDA & IBRD countries)EcuadorEgypt, Arab Rep.El SalvadorEritreaEstoniaEthiopiaEuro areaEurope & Central AsiaEurope & Central Asia (excluding high income)Europe & Central Asia (IDA & IBRD countries)European UnionFaroe IslandsFijiFinlandFragile and conflict affected situationsFranceFrench PolynesiaGabonGambia, TheGeorgiaGermanyGhanaGreeceGrenadaGuatemalaGuineaGuinea-BissauGuyanaHaitiHeavily indebted poor countries (HIPC)High incomeHondurasHong Kong SAR, ChinaHungaryIBRD onlyIcelandIDA & IBRD totalIDA onlyIDA totalIndiaIndonesiaIran, Islamic Rep.IraqIrelandIsraelItalyJamaicaJapanJordanKazakhstanKenyaKiribatiKorea, Rep.KosovoKuwaitKyrgyz RepublicLao PDRLate-demographic dividendLatin America & Caribbean Latin America & Caribbean (excluding high income)Latin America & the Caribbean (IDA & IBRD countries)LatviaLeast developed countries: UN classificationLebanonLesothoLiberiaLibyaLithuaniaLow & middle incomeLow incomeLower middle incomeLuxembourgMacao SAR, ChinaMacedonia, FYRMadagascarMalawiMalaysiaMaldivesMaliMaltaMarshall IslandsMauritaniaMauritiusMexicoMicronesia, Fed. Sts.Middle East & North Africa (excluding high income)Middle East & North Africa (IDA & IBRD countries)Middle incomeMoldovaMongoliaMontenegroMoroccoMozambiqueMyanmarNamibiaNepalNetherlandsNew CaledoniaNew ZealandNicaraguaNigerNigeriaNorth AmericaNorwayOECD membersOmanOther small statesPacific island small statesPakistanPalauPanamaPapua New GuineaParaguayPeruPhilippinesPolandPortugalPost-demographic dividendPre-demographic dividendQatarRomaniaRussian FederationRwandaSamoaSao Tome and PrincipeSaudi ArabiaSenegalSerbiaSeychellesSierra LeoneSingaporeSint Maarten (Dutch part)Slovak RepublicSloveniaSmall statesSolomon IslandsSouth AfricaSouth AsiaSouth Asia (IDA & IBRD)South SudanSpainSri LankaSt. Kitts and NevisSt. LuciaSt. Vincent and the GrenadinesSub-Saharan Africa Sub-Saharan Africa (excluding high income)Sub-Saharan Africa (IDA & IBRD countries)SudanSurinameSwazilandSwedenSwitzerlandSyrian Arab RepublicTajikistanTanzaniaThailandTimor-LesteTogoTongaTrinidad and TobagoTunisiaTurkeyTuvaluUgandaUkraineUnited KingdomUnited StatesUpper middle incomeUruguayVanuatuVenezuela, RBWest Bank and GazaWorldYemen, Rep.ZambiaZimbabwe Timeline:
This timeline shows a graph from 1975 to 2015 of Togo. No data until 1974. Number of actual observations by date: 41.
Source name:
World Development Indicators
Source organization:
International Monetary Fund, Balance of Payments Statistics Yearbook and data files.
Categories, topics:
Economy & Growth, Trade
Last updated:
apr 23, 2017
Indicators value changes by year
Maximum:
45.168
jan 1, 1983
At the date of observation
Value
Absolute change
Change from previous value
jan 1, 1975
26.061
+26.061
0.0%
jan 1, 1976
24.825
-1.236
-4.74%
jan 1, 1977
34.067
+9.242
37.23%
jan 1, 1978
35.831
+1.764
5.18%
jan 1, 1979
37.026
+1.195
3.34%
jan 1, 1980
37.643
+0.617
1.67%
jan 1, 1981
35.226
-2.417
-6.42%
jan 1, 1982
42.655
+7.429
21.09%
jan 1, 1983
45.168
+2.513
5.89%
jan 1, 1984
42.238
-2.93
-6.49%
jan 1, 1985
39.558
-2.681
-6.35%
jan 1, 1986
28.727
-10.83
-27.38%
jan 1, 1987
32.83
+4.103
14.28%
jan 1, 1988
29.37
-3.461
-10.54%
jan 1, 1989
34.629
+5.259
17.91%
jan 1, 1990
38.923
+4.295
12.4%
jan 1, 1991
38.851
-0.072
-0.18%
jan 1, 1992
41.707
+2.856
7.35%
jan 1, 1993
30.117
-11.59
-27.79%
jan 1, 1994
11.888
-18.229
-60.53%
jan 1, 1995
16.172
+4.284
36.03%
jan 1, 1996
14.537
-1.635
-10.11%
jan 1, 1997
8.429
-6.107
-42.01%
jan 1, 1998
13.449
+5.019
59.54%
jan 1, 1999
13.936
+0.487
3.62%
jan 1, 2000
10.071
-3.865
-27.73%
jan 1, 2001
13.018
+2.947
29.26%
jan 1, 2002
15.158
+2.14
16.44%
jan 1, 2003
14.688
-0.47
-3.1%
jan 1, 2004
15.531
+0.843
5.74%
jan 1, 2005
12.764
-2.767
-17.81%
jan 1, 2006
11.519
-1.245
-9.76%
jan 1, 2007
10.231
-1.288
-11.18%
jan 1, 2008
14.471
+4.241
41.45%
jan 1, 2009
13.963
-0.508
-3.51%
jan 1, 2010
23.274
+9.311
66.68%
jan 1, 2011
20.462
-2.812
-12.08%
jan 1, 2012
19.213
-1.249
-6.1%
jan 1, 2013
24.304
+5.091
26.5%
jan 1, 2014
25.811
+1.507
6.2%
jan 1, 2015
25.602
-0.209
-0.81%
Ranking of countries by current statistics by years


Comments: