29
/
en
AIzaSyAYiBZKx7MnpbEhh9jyipgxe19OcubqV5w
April 1, 2024
45765
Low & middle income
LMY
false
2
1
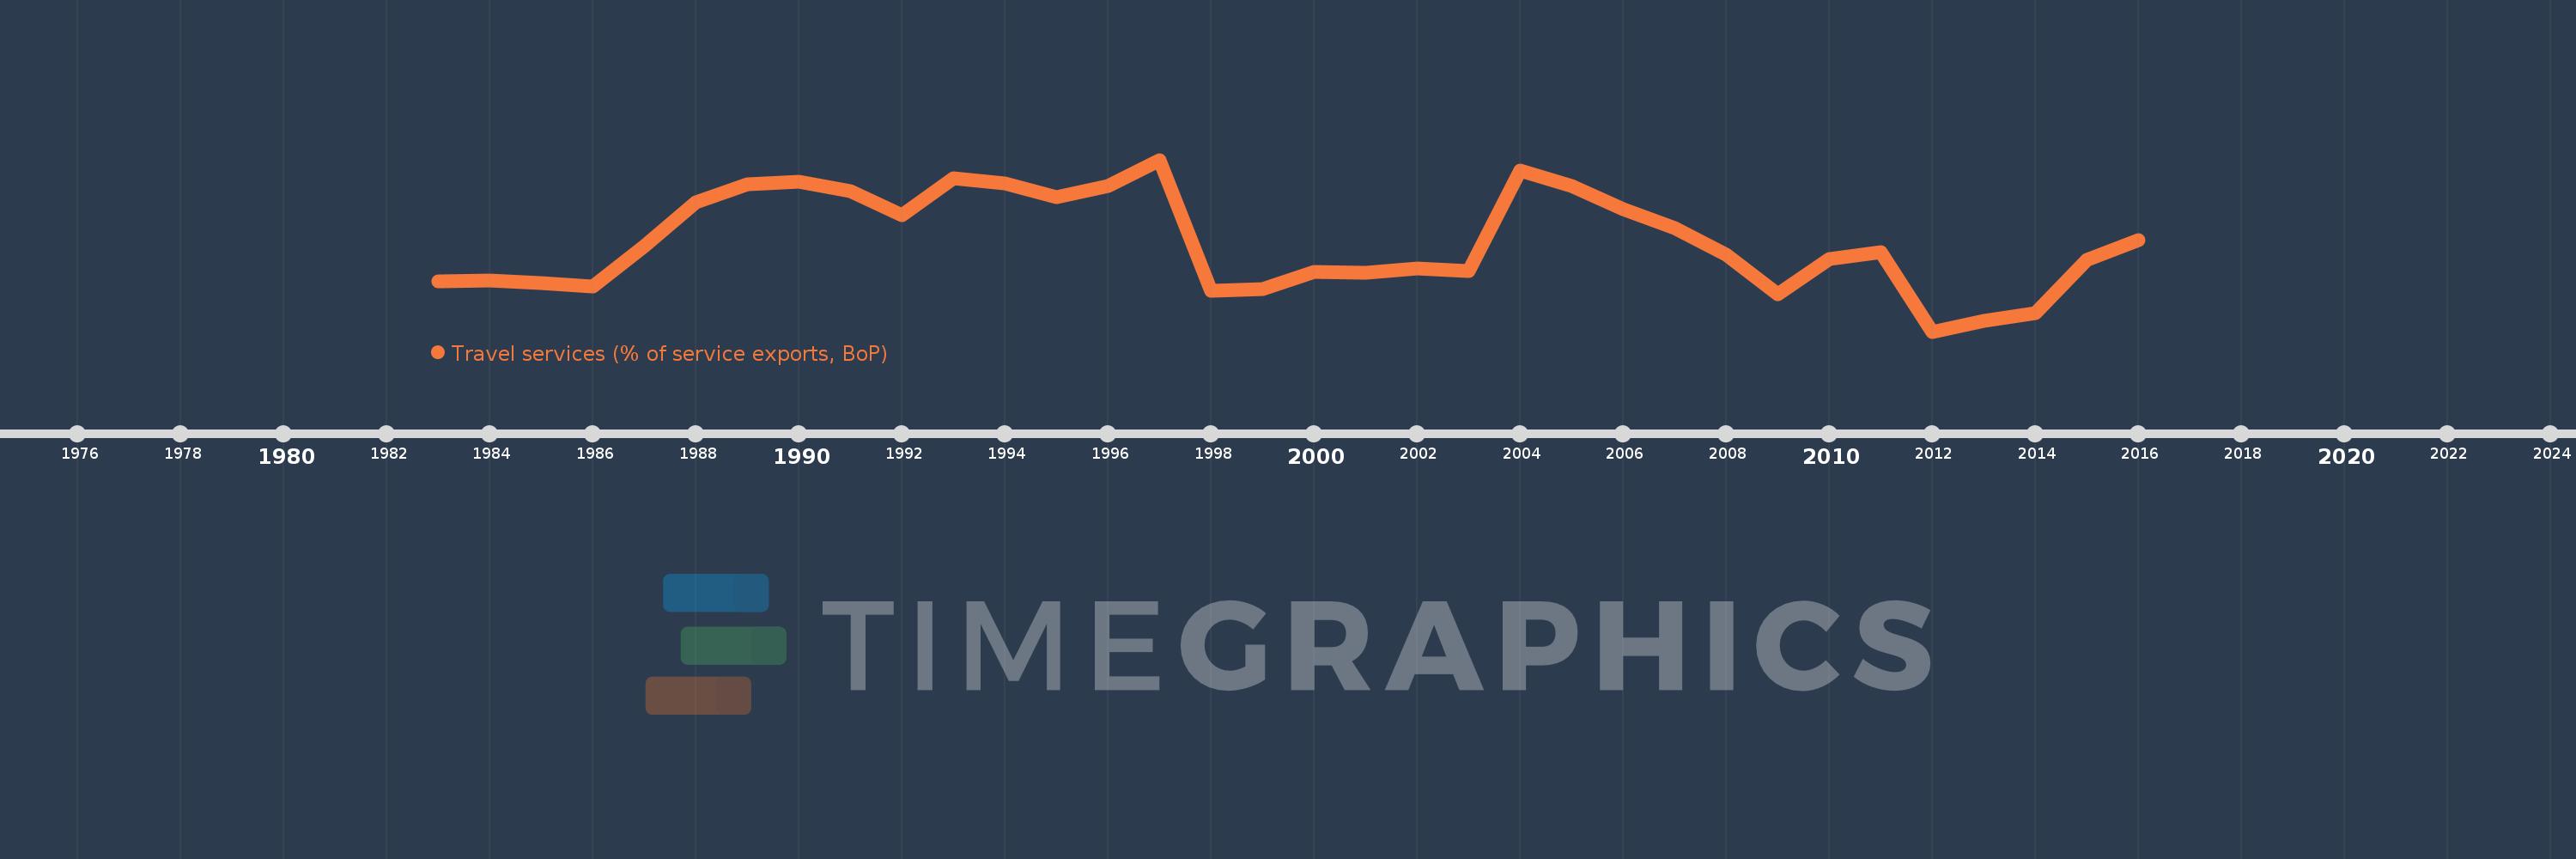
Travel services (% of service exports, BoP)
2016,2015,2014,2013,2012,2011,2010,2009,2008,2007,2006,2005,2004,2003,2002,2001,2000,1999,1998,1997,1996,1995,1994,1993,1992,1991,1990,1989,1988,1987,1986,1985,1984,1983
This statistics in other country:
AfghanistanAlbaniaAlgeriaAngolaAntigua and BarbudaArab WorldArgentinaArmeniaArubaAustraliaAustriaAzerbaijanBahamas, TheBahrainBangladeshBarbadosBelarusBelgiumBelizeBeninBermudaBhutanBoliviaBosnia and HerzegovinaBotswanaBrazilBrunei DarussalamBulgariaBurkina FasoBurundiCabo VerdeCambodiaCameroonCanadaCaribbean small statesCentral African RepublicCentral Europe and the BalticsChadChileChinaColombiaComorosCongo, Dem. Rep.Congo, Rep.Costa RicaCote d'IvoireCroatiaCuracaoCyprusCzech RepublicDenmarkDjiboutiDominicaDominican RepublicEarly-demographic dividendEast Asia & PacificEast Asia & Pacific (excluding high income)East Asia & Pacific (IDA & IBRD countries)EcuadorEgypt, Arab Rep.El SalvadorEritreaEstoniaEthiopiaEuro areaEurope & Central AsiaEurope & Central Asia (excluding high income)Europe & Central Asia (IDA & IBRD countries)European UnionFaroe IslandsFijiFinlandFragile and conflict affected situationsFranceFrench PolynesiaGabonGambia, TheGeorgiaGermanyGhanaGreeceGrenadaGuatemalaGuineaGuinea-BissauGuyanaHaitiHeavily indebted poor countries (HIPC)High incomeHondurasHong Kong SAR, ChinaHungaryIBRD onlyIcelandIDA & IBRD totalIDA onlyIDA totalIndiaIndonesiaIran, Islamic Rep.IraqIrelandIsraelItalyJamaicaJapanJordanKazakhstanKenyaKiribatiKorea, Rep.KosovoKuwaitKyrgyz RepublicLao PDRLate-demographic dividendLatin America & Caribbean Latin America & Caribbean (excluding high income)Latin America & the Caribbean (IDA & IBRD countries)LatviaLeast developed countries: UN classificationLebanonLesothoLiberiaLibyaLithuaniaLow & middle incomeLow incomeLower middle incomeLuxembourgMacao SAR, ChinaMacedonia, FYRMadagascarMalawiMalaysiaMaldivesMaliMaltaMarshall IslandsMauritaniaMauritiusMexicoMicronesia, Fed. Sts.Middle East & North Africa (excluding high income)Middle East & North Africa (IDA & IBRD countries)Middle incomeMoldovaMongoliaMontenegroMoroccoMozambiqueMyanmarNamibiaNepalNetherlandsNew CaledoniaNew ZealandNicaraguaNigerNigeriaNorth AmericaNorwayOECD membersOmanOther small statesPacific island small statesPakistanPalauPanamaPapua New GuineaParaguayPeruPhilippinesPolandPortugalPost-demographic dividendPre-demographic dividendQatarRomaniaRussian FederationRwandaSamoaSao Tome and PrincipeSaudi ArabiaSenegalSerbiaSeychellesSierra LeoneSingaporeSint Maarten (Dutch part)Slovak RepublicSloveniaSmall statesSolomon IslandsSouth AfricaSouth AsiaSouth Asia (IDA & IBRD)South SudanSpainSri LankaSt. Kitts and NevisSt. LuciaSt. Vincent and the GrenadinesSub-Saharan Africa Sub-Saharan Africa (excluding high income)Sub-Saharan Africa (IDA & IBRD countries)SudanSurinameSwazilandSwedenSwitzerlandSyrian Arab RepublicTajikistanTanzaniaThailandTimor-LesteTogoTongaTrinidad and TobagoTunisiaTurkeyTuvaluUgandaUkraineUnited KingdomUnited StatesUpper middle incomeUruguayVanuatuVenezuela, RBWest Bank and GazaWorldYemen, Rep.ZambiaZimbabwe Timeline:
This timeline shows a graph from 1983 to 2016 of Low & middle income. No data until 1982. Number of actual observations by date: 34.
Source name:
World Development Indicators
Source organization:
International Monetary Fund, Balance of Payments Statistics Yearbook and data files.
Categories, topics:
Economy & Growth, Trade
Last updated:
apr 23, 2017
Indicators value changes by year
Minimum:
32.189
jan 1, 2012
Maximum:
41.667
jan 1, 1997
At the date of observation
Value
Absolute change
Change from previous value
jan 1, 1983
34.954
+34.954
0.0%
jan 1, 1984
35.003
+0.049
0.14%
jan 1, 1985
34.89
-0.113
-0.32%
jan 1, 1986
34.676
-0.213
-0.61%
jan 1, 1987
36.909
+2.233
6.44%
jan 1, 1988
39.3
+2.39
6.48%
jan 1, 1989
40.317
+1.017
2.59%
jan 1, 1990
40.457
+0.14
0.35%
jan 1, 1991
39.917
-0.54
-1.34%
jan 1, 1992
38.623
-1.294
-3.24%
jan 1, 1993
40.653
+2.029
5.25%
jan 1, 1994
40.385
-0.267
-0.66%
jan 1, 1995
39.609
-0.776
-1.92%
jan 1, 1996
40.226
+0.617
1.56%
jan 1, 1997
41.667
+1.441
3.58%
jan 1, 1998
34.462
-7.205
-17.29%
jan 1, 1999
34.547
+0.085
0.25%
jan 1, 2000
35.466
+0.918
2.66%
jan 1, 2001
35.414
-0.052
-0.15%
jan 1, 2002
35.668
+0.254
0.72%
jan 1, 2003
35.527
-0.14
-0.39%
jan 1, 2004
41.063
+5.536
15.58%
jan 1, 2005
40.229
-0.834
-2.03%
jan 1, 2006
38.955
-1.274
-3.17%
jan 1, 2007
37.885
-1.07
-2.75%
jan 1, 2008
36.424
-1.461
-3.86%
jan 1, 2009
34.25
-2.174
-5.97%
jan 1, 2010
36.207
+1.957
5.71%
jan 1, 2011
36.574
+0.367
1.01%
jan 1, 2012
32.189
-4.386
-11.99%
jan 1, 2013
32.788
+0.6
1.86%
jan 1, 2014
33.2
+0.411
1.25%
jan 1, 2015
36.144
+2.944
8.87%
jan 1, 2016
37.214
+1.07
2.96%
Ranking of countries by current statistics by years


Comments: