29
/
en
AIzaSyAYiBZKx7MnpbEhh9jyipgxe19OcubqV5w
April 1, 2024
199981
Mongolia
MNG
true
2
1
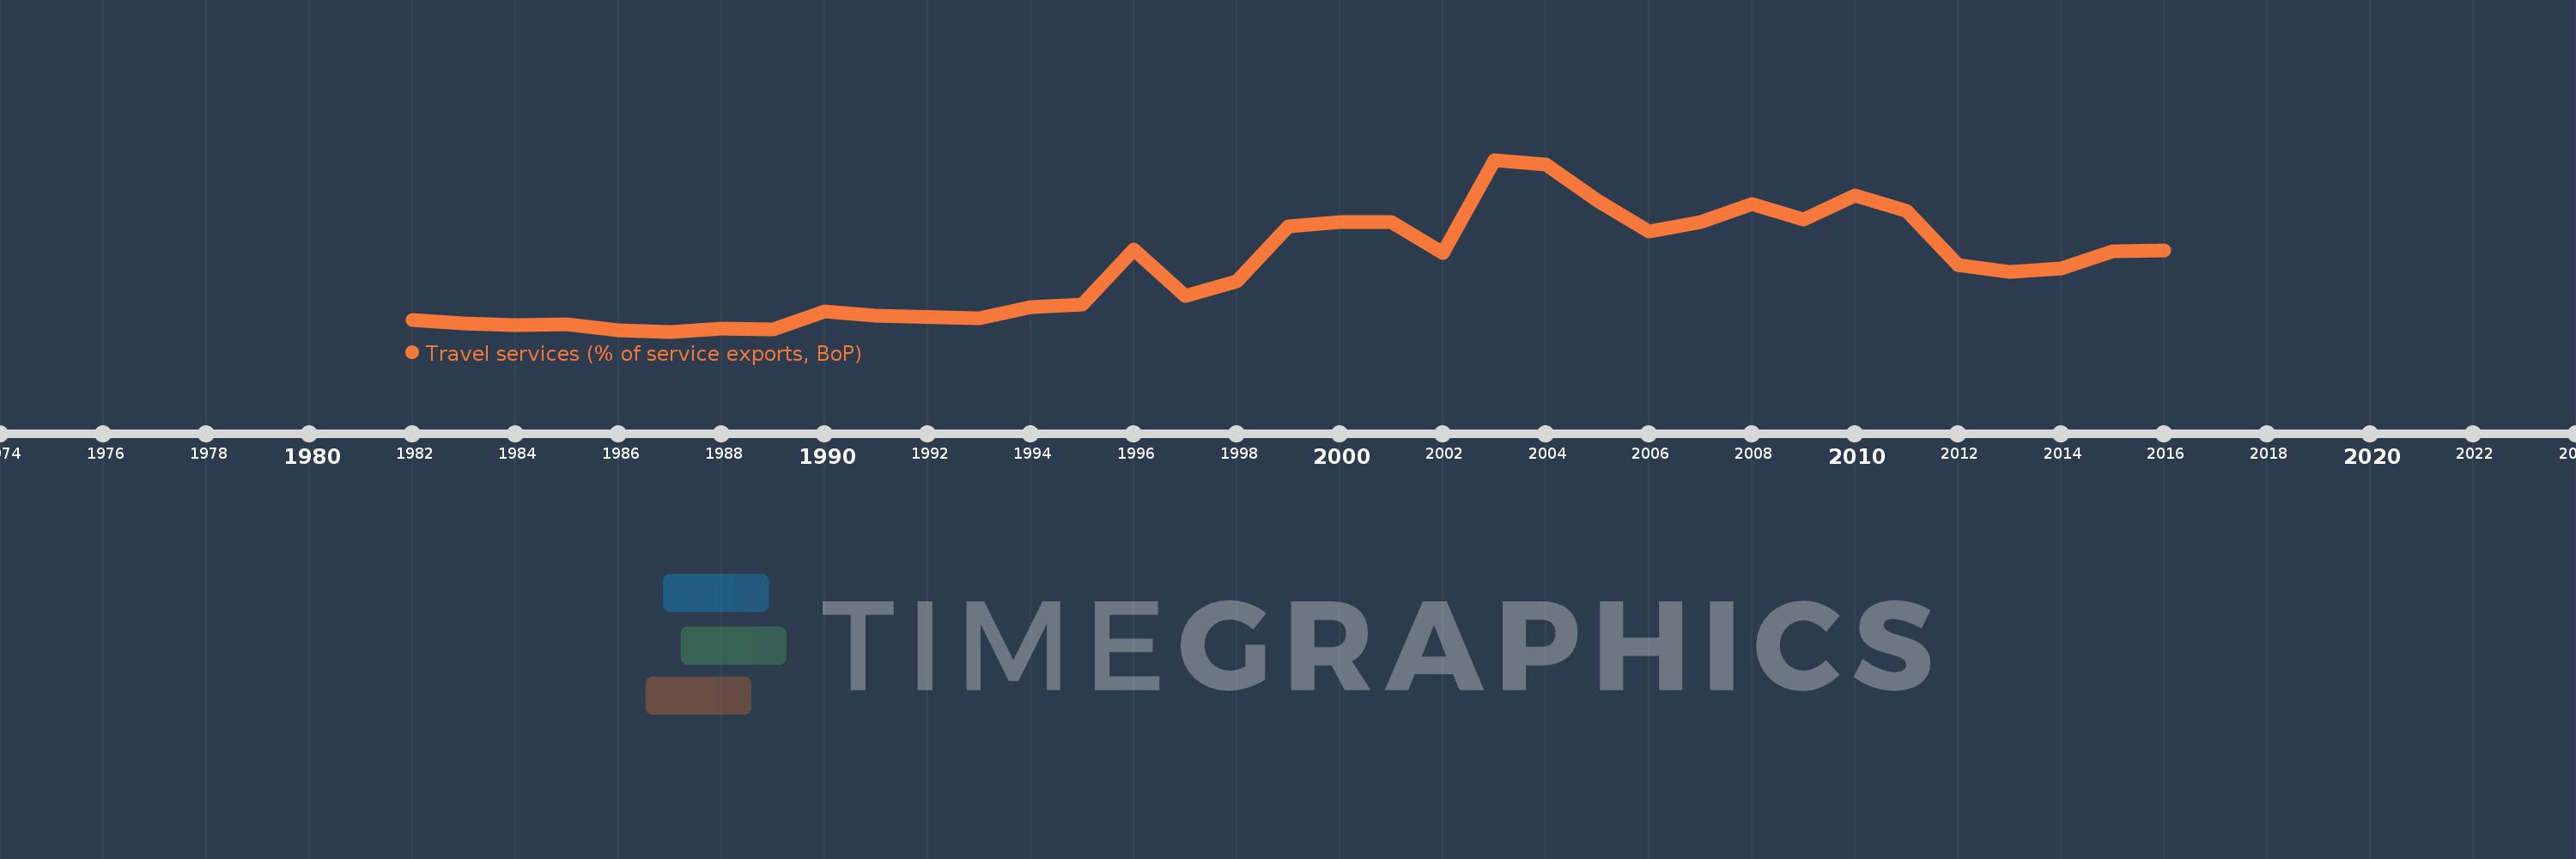
Travel services (% of service exports, BoP)
2016,2015,2014,2013,2012,2011,2010,2009,2008,2007,2006,2005,2004,2003,2002,2001,2000,1999,1998,1997,1996,1995,1994,1993,1991,1990,1989,1988,1987,1986,1985,1984,1983,1982
This statistics in other country:
AfghanistanAlbaniaAlgeriaAngolaAntigua and BarbudaArab WorldArgentinaArmeniaArubaAustraliaAustriaAzerbaijanBahamas, TheBahrainBangladeshBarbadosBelarusBelgiumBelizeBeninBermudaBhutanBoliviaBosnia and HerzegovinaBotswanaBrazilBrunei DarussalamBulgariaBurkina FasoBurundiCabo VerdeCambodiaCameroonCanadaCaribbean small statesCentral African RepublicCentral Europe and the BalticsChadChileChinaColombiaComorosCongo, Dem. Rep.Congo, Rep.Costa RicaCote d'IvoireCroatiaCuracaoCyprusCzech RepublicDenmarkDjiboutiDominicaDominican RepublicEarly-demographic dividendEast Asia & PacificEast Asia & Pacific (excluding high income)East Asia & Pacific (IDA & IBRD countries)EcuadorEgypt, Arab Rep.El SalvadorEritreaEstoniaEthiopiaEuro areaEurope & Central AsiaEurope & Central Asia (excluding high income)Europe & Central Asia (IDA & IBRD countries)European UnionFaroe IslandsFijiFinlandFragile and conflict affected situationsFranceFrench PolynesiaGabonGambia, TheGeorgiaGermanyGhanaGreeceGrenadaGuatemalaGuineaGuinea-BissauGuyanaHaitiHeavily indebted poor countries (HIPC)High incomeHondurasHong Kong SAR, ChinaHungaryIBRD onlyIcelandIDA & IBRD totalIDA onlyIDA totalIndiaIndonesiaIran, Islamic Rep.IraqIrelandIsraelItalyJamaicaJapanJordanKazakhstanKenyaKiribatiKorea, Rep.KosovoKuwaitKyrgyz RepublicLao PDRLate-demographic dividendLatin America & Caribbean Latin America & Caribbean (excluding high income)Latin America & the Caribbean (IDA & IBRD countries)LatviaLeast developed countries: UN classificationLebanonLesothoLiberiaLibyaLithuaniaLow & middle incomeLow incomeLower middle incomeLuxembourgMacao SAR, ChinaMacedonia, FYRMadagascarMalawiMalaysiaMaldivesMaliMaltaMarshall IslandsMauritaniaMauritiusMexicoMicronesia, Fed. Sts.Middle East & North Africa (excluding high income)Middle East & North Africa (IDA & IBRD countries)Middle incomeMoldovaMongoliaMontenegroMoroccoMozambiqueMyanmarNamibiaNepalNetherlandsNew CaledoniaNew ZealandNicaraguaNigerNigeriaNorth AmericaNorwayOECD membersOmanOther small statesPacific island small statesPakistanPalauPanamaPapua New GuineaParaguayPeruPhilippinesPolandPortugalPost-demographic dividendPre-demographic dividendQatarRomaniaRussian FederationRwandaSamoaSao Tome and PrincipeSaudi ArabiaSenegalSerbiaSeychellesSierra LeoneSingaporeSint Maarten (Dutch part)Slovak RepublicSloveniaSmall statesSolomon IslandsSouth AfricaSouth AsiaSouth Asia (IDA & IBRD)South SudanSpainSri LankaSt. Kitts and NevisSt. LuciaSt. Vincent and the GrenadinesSub-Saharan Africa Sub-Saharan Africa (excluding high income)Sub-Saharan Africa (IDA & IBRD countries)SudanSurinameSwazilandSwedenSwitzerlandSyrian Arab RepublicTajikistanTanzaniaThailandTimor-LesteTogoTongaTrinidad and TobagoTunisiaTurkeyTuvaluUgandaUkraineUnited KingdomUnited StatesUpper middle incomeUruguayVanuatuVenezuela, RBWest Bank and GazaWorldYemen, Rep.ZambiaZimbabwe Timeline:
This timeline shows a graph from 1982 to 2016 of Mongolia. No data until 1981. Number of actual observations by date: 34.
Source name:
World Development Indicators
Source organization:
International Monetary Fund, Balance of Payments Statistics Yearbook and data files.
Categories, topics:
Economy & Growth, Trade
Last updated:
apr 23, 2017
Indicators value changes by year
Maximum:
70.478
jan 1, 2003
At the date of observation
Value
Absolute change
Change from previous value
jan 1, 1982
8.579
+8.579
0.0%
jan 1, 1983
7.423
-1.156
-13.48%
jan 1, 1984
6.51
-0.913
-12.3%
jan 1, 1985
6.844
+0.334
5.13%
jan 1, 1986
4.565
-2.279
-33.3%
jan 1, 1987
4.157
-0.408
-8.94%
jan 1, 1988
5.281
+1.124
27.04%
jan 1, 1989
5.09
-0.191
-3.61%
jan 1, 1990
12.088
+6.998
137.48%
jan 1, 1991
10.395
-1.693
-14.0%
jan 1, 1993
9.195
-1.2
-11.54%
jan 1, 1994
13.462
+4.266
46.39%
jan 1, 1995
14.537
+1.076
7.99%
jan 1, 1996
35.951
+21.414
147.3%
jan 1, 1997
17.953
-17.998
-50.06%
jan 1, 1998
23.719
+5.766
32.12%
jan 1, 1999
44.929
+21.21
89.42%
jan 1, 2000
46.288
+1.358
3.02%
jan 1, 2001
46.278
-0.01
-0.02%
jan 1, 2002
34.643
-11.635
-25.14%
jan 1, 2003
70.478
+35.836
103.44%
jan 1, 2004
68.758
-1.72
-2.44%
jan 1, 2005
54.726
-14.032
-20.41%
jan 1, 2006
42.656
-12.07
-22.06%
jan 1, 2007
46.337
+3.68
8.63%
jan 1, 2008
53.425
+7.088
15.3%
jan 1, 2009
47.488
-5.937
-11.11%
jan 1, 2010
56.582
+9.094
19.15%
jan 1, 2011
50.59
-5.991
-10.59%
jan 1, 2012
29.916
-20.674
-40.87%
jan 1, 2013
27.17
-2.746
-9.18%
jan 1, 2014
28.526
+1.356
4.99%
jan 1, 2015
35.254
+6.728
23.59%
jan 1, 2016
35.558
+0.304
0.86%
Ranking of countries by current statistics by years


Comments: