29
/
en
AIzaSyAYiBZKx7MnpbEhh9jyipgxe19OcubqV5w
April 1, 2024
186019
Madagascar
MDG
true
2
1
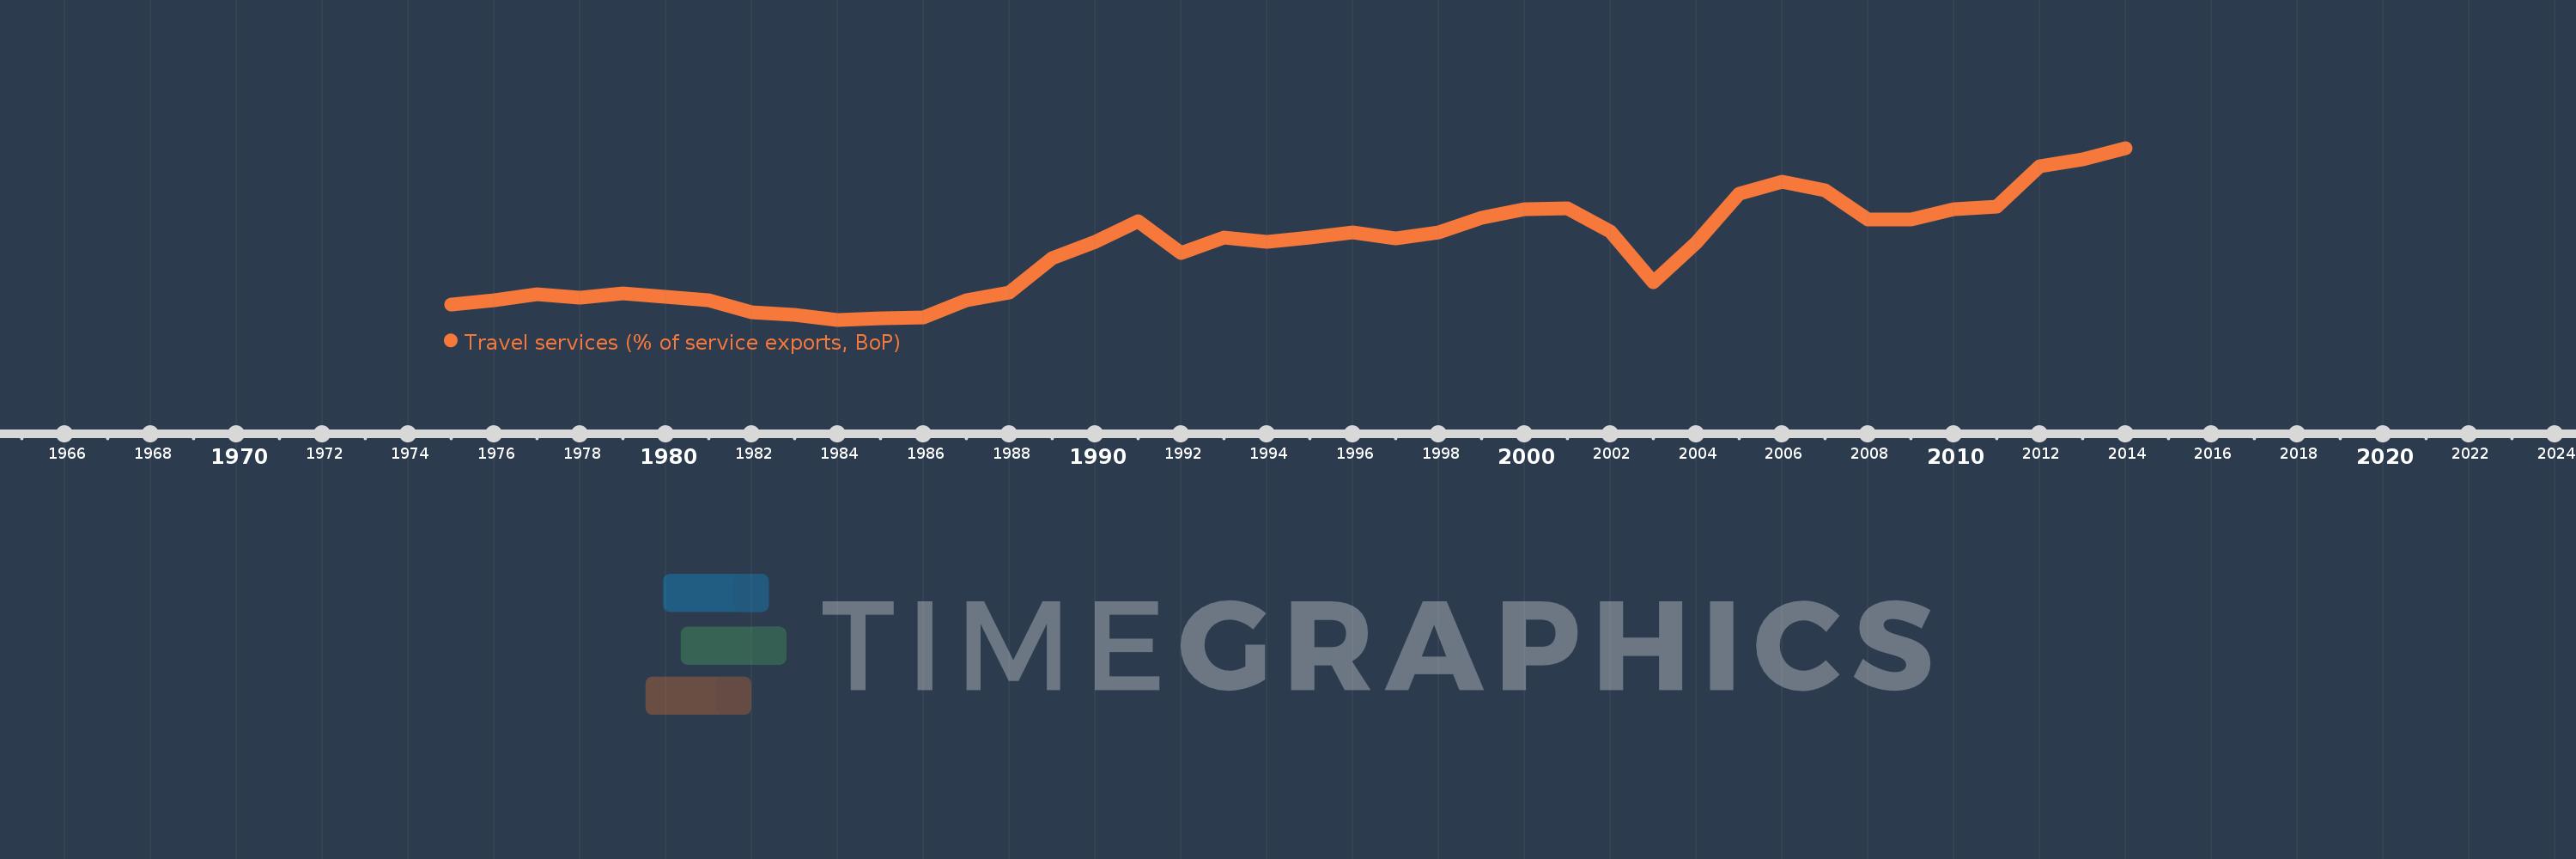
Travel services (% of service exports, BoP)
2014,2013,2012,2011,2010,2009,2008,2007,2006,2005,2004,2003,2002,2001,2000,1999,1998,1997,1996,1995,1994,1993,1992,1991,1990,1989,1988,1987,1986,1985,1984,1983,1982,1981,1980,1979,1978,1977,1976,1975
This statistics in other country:
AfghanistanAlbaniaAlgeriaAngolaAntigua and BarbudaArab WorldArgentinaArmeniaArubaAustraliaAustriaAzerbaijanBahamas, TheBahrainBangladeshBarbadosBelarusBelgiumBelizeBeninBermudaBhutanBoliviaBosnia and HerzegovinaBotswanaBrazilBrunei DarussalamBulgariaBurkina FasoBurundiCabo VerdeCambodiaCameroonCanadaCaribbean small statesCentral African RepublicCentral Europe and the BalticsChadChileChinaColombiaComorosCongo, Dem. Rep.Congo, Rep.Costa RicaCote d'IvoireCroatiaCuracaoCyprusCzech RepublicDenmarkDjiboutiDominicaDominican RepublicEarly-demographic dividendEast Asia & PacificEast Asia & Pacific (excluding high income)East Asia & Pacific (IDA & IBRD countries)EcuadorEgypt, Arab Rep.El SalvadorEritreaEstoniaEthiopiaEuro areaEurope & Central AsiaEurope & Central Asia (excluding high income)Europe & Central Asia (IDA & IBRD countries)European UnionFaroe IslandsFijiFinlandFragile and conflict affected situationsFranceFrench PolynesiaGabonGambia, TheGeorgiaGermanyGhanaGreeceGrenadaGuatemalaGuineaGuinea-BissauGuyanaHaitiHeavily indebted poor countries (HIPC)High incomeHondurasHong Kong SAR, ChinaHungaryIBRD onlyIcelandIDA & IBRD totalIDA onlyIDA totalIndiaIndonesiaIran, Islamic Rep.IraqIrelandIsraelItalyJamaicaJapanJordanKazakhstanKenyaKiribatiKorea, Rep.KosovoKuwaitKyrgyz RepublicLao PDRLate-demographic dividendLatin America & Caribbean Latin America & Caribbean (excluding high income)Latin America & the Caribbean (IDA & IBRD countries)LatviaLeast developed countries: UN classificationLebanonLesothoLiberiaLibyaLithuaniaLow & middle incomeLow incomeLower middle incomeLuxembourgMacao SAR, ChinaMacedonia, FYRMadagascarMalawiMalaysiaMaldivesMaliMaltaMarshall IslandsMauritaniaMauritiusMexicoMicronesia, Fed. Sts.Middle East & North Africa (excluding high income)Middle East & North Africa (IDA & IBRD countries)Middle incomeMoldovaMongoliaMontenegroMoroccoMozambiqueMyanmarNamibiaNepalNetherlandsNew CaledoniaNew ZealandNicaraguaNigerNigeriaNorth AmericaNorwayOECD membersOmanOther small statesPacific island small statesPakistanPalauPanamaPapua New GuineaParaguayPeruPhilippinesPolandPortugalPost-demographic dividendPre-demographic dividendQatarRomaniaRussian FederationRwandaSamoaSao Tome and PrincipeSaudi ArabiaSenegalSerbiaSeychellesSierra LeoneSingaporeSint Maarten (Dutch part)Slovak RepublicSloveniaSmall statesSolomon IslandsSouth AfricaSouth AsiaSouth Asia (IDA & IBRD)South SudanSpainSri LankaSt. Kitts and NevisSt. LuciaSt. Vincent and the GrenadinesSub-Saharan Africa Sub-Saharan Africa (excluding high income)Sub-Saharan Africa (IDA & IBRD countries)SudanSurinameSwazilandSwedenSwitzerlandSyrian Arab RepublicTajikistanTanzaniaThailandTimor-LesteTogoTongaTrinidad and TobagoTunisiaTurkeyTuvaluUgandaUkraineUnited KingdomUnited StatesUpper middle incomeUruguayVanuatuVenezuela, RBWest Bank and GazaWorldYemen, Rep.ZambiaZimbabwe Timeline:
This timeline shows a graph from 1975 to 2014 of Madagascar. No data until 1974. Number of actual observations by date: 40.
Source name:
World Development Indicators
Source organization:
International Monetary Fund, Balance of Payments Statistics Yearbook and data files.
Categories, topics:
Economy & Growth, Trade
Last updated:
apr 23, 2017
Indicators value changes by year
Maximum:
45.369
jan 1, 2014
At the date of observation
Value
Absolute change
Change from previous value
jan 1, 1975
5.171
+5.171
0.0%
jan 1, 1976
6.095
+0.924
17.87%
jan 1, 1977
7.669
+1.574
25.82%
jan 1, 1978
6.909
-0.76
-9.91%
jan 1, 1979
7.878
+0.969
14.03%
jan 1, 1980
7.188
-0.69
-8.76%
jan 1, 1981
6.254
-0.935
-13.0%
jan 1, 1982
3.05
-3.203
-51.23%
jan 1, 1983
2.435
-0.615
-20.18%
jan 1, 1984
1.182
-1.253
-51.46%
jan 1, 1985
1.529
+0.347
29.36%
jan 1, 1986
1.726
+0.197
12.88%
jan 1, 1987
6.243
+4.517
261.7%
jan 1, 1988
8.09
+1.848
29.6%
jan 1, 1989
17.029
+8.938
110.48%
jan 1, 1990
21.144
+4.115
24.17%
jan 1, 1991
26.443
+5.299
25.06%
jan 1, 1992
18.452
-7.991
-30.22%
jan 1, 1993
22.356
+3.904
21.16%
jan 1, 1994
21.178
-1.178
-5.27%
jan 1, 1995
22.377
+1.199
5.66%
jan 1, 1996
23.617
+1.24
5.54%
jan 1, 1997
22.079
-1.538
-6.51%
jan 1, 1998
23.584
+1.506
6.82%
jan 1, 1999
27.326
+3.741
15.86%
jan 1, 2000
29.602
+2.276
8.33%
jan 1, 2001
29.799
+0.197
0.67%
jan 1, 2002
23.838
-5.961
-20.01%
jan 1, 2003
10.939
-12.899
-54.11%
jan 1, 2004
20.995
+10.056
91.93%
jan 1, 2005
33.597
+12.602
60.03%
jan 1, 2006
36.615
+3.018
8.98%
jan 1, 2007
34.571
-2.044
-5.58%
jan 1, 2008
26.973
-7.598
-21.98%
jan 1, 2009
26.855
-0.118
-0.44%
jan 1, 2010
29.609
+2.754
10.25%
jan 1, 2011
30.322
+0.714
2.41%
jan 1, 2012
40.565
+10.242
33.78%
jan 1, 2013
42.496
+1.931
4.76%
jan 1, 2014
45.369
+2.873
6.76%
Ranking of countries by current statistics by years


Comments: