29
/
en
AIzaSyAYiBZKx7MnpbEhh9jyipgxe19OcubqV5w
April 1, 2024
246422
South Africa
ZAF
true
2
1
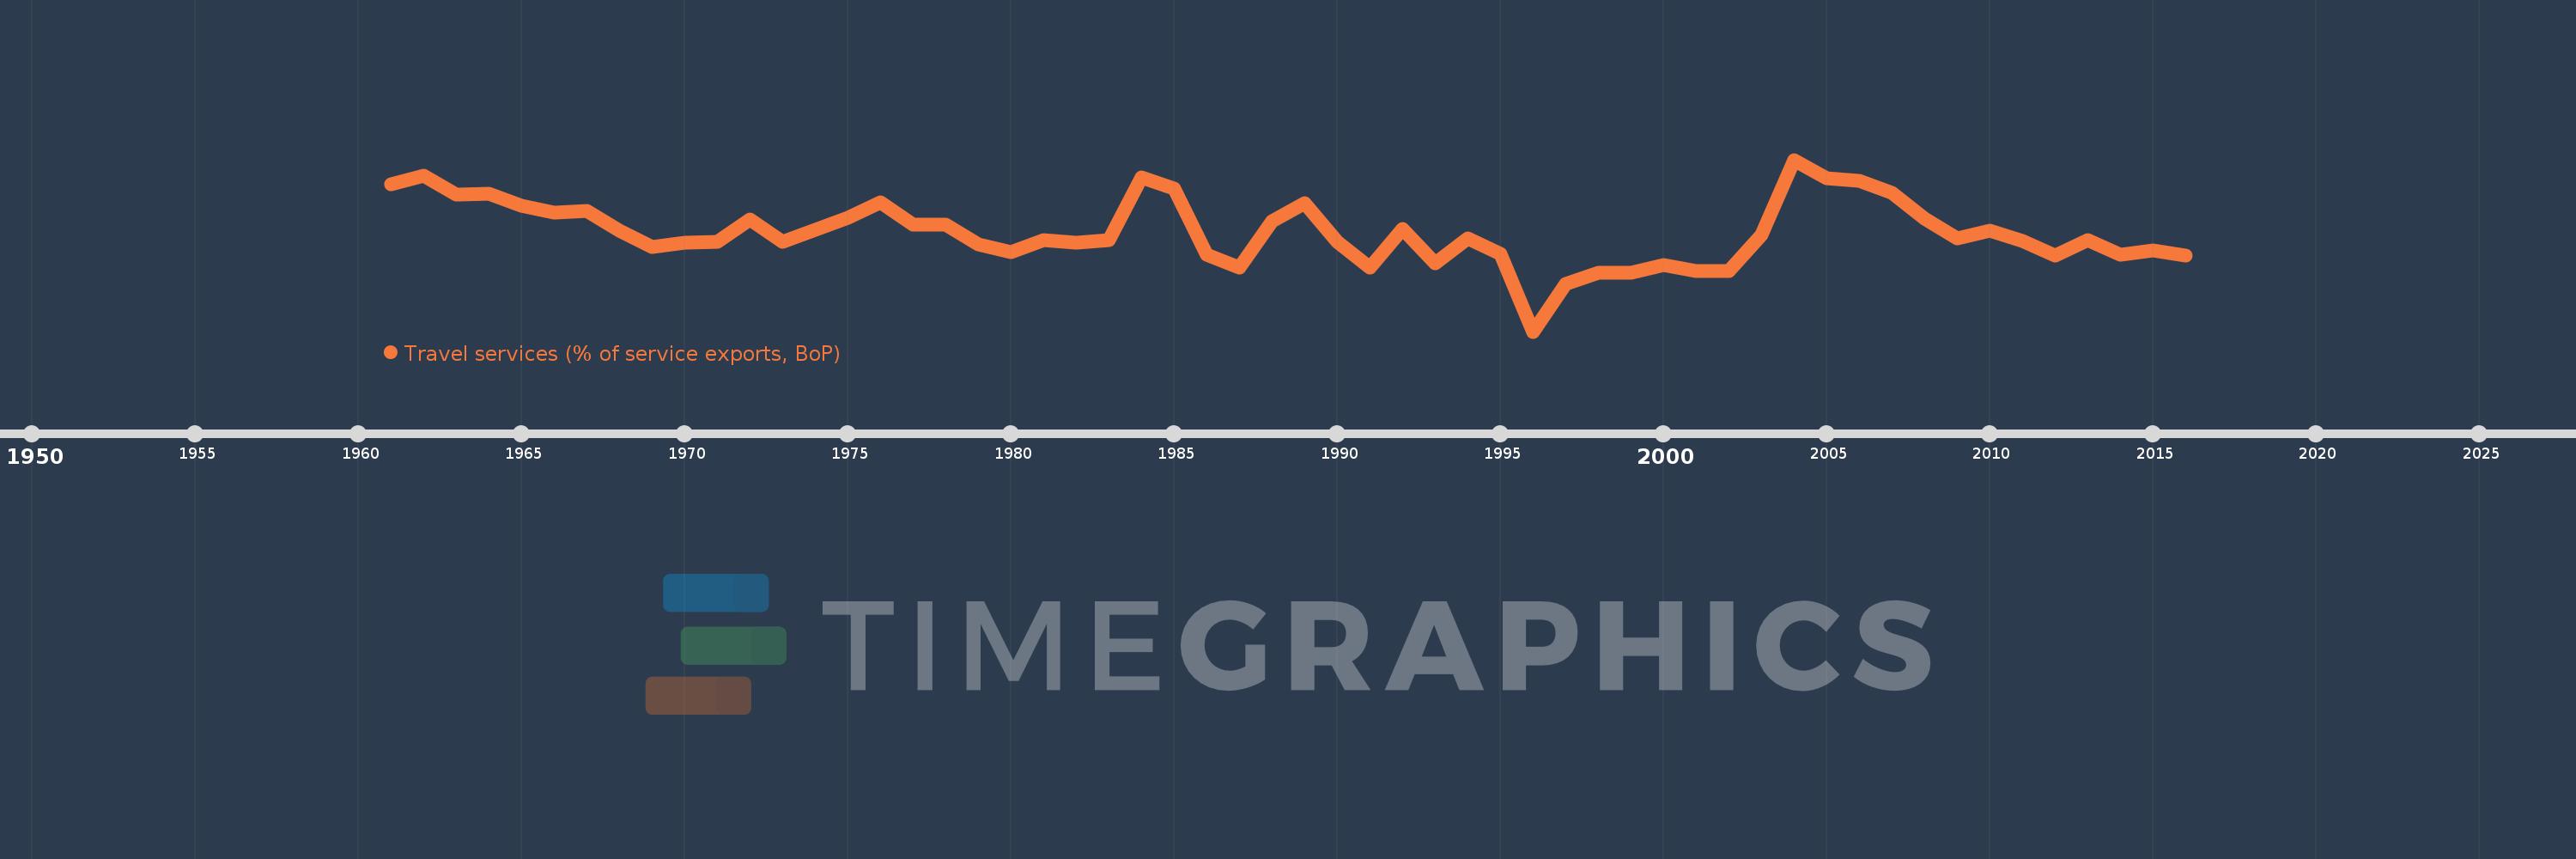
Travel services (% of service exports, BoP)
2016,2015,2014,2013,2012,2011,2010,2009,2008,2007,2006,2005,2004,2003,2002,2001,2000,1999,1998,1997,1996,1995,1994,1993,1992,1991,1990,1989,1988,1987,1986,1985,1984,1983,1982,1981,1980,1979,1978,1977,1976,1975,1974,1973,1972,1971,1970,1969,1968,1967,1966,1965,1964,1963,1962,1961
This statistics in other country:
AfghanistanAlbaniaAlgeriaAngolaAntigua and BarbudaArab WorldArgentinaArmeniaArubaAustraliaAustriaAzerbaijanBahamas, TheBahrainBangladeshBarbadosBelarusBelgiumBelizeBeninBermudaBhutanBoliviaBosnia and HerzegovinaBotswanaBrazilBrunei DarussalamBulgariaBurkina FasoBurundiCabo VerdeCambodiaCameroonCanadaCaribbean small statesCentral African RepublicCentral Europe and the BalticsChadChileChinaColombiaComorosCongo, Dem. Rep.Congo, Rep.Costa RicaCote d'IvoireCroatiaCuracaoCyprusCzech RepublicDenmarkDjiboutiDominicaDominican RepublicEarly-demographic dividendEast Asia & PacificEast Asia & Pacific (excluding high income)East Asia & Pacific (IDA & IBRD countries)EcuadorEgypt, Arab Rep.El SalvadorEritreaEstoniaEthiopiaEuro areaEurope & Central AsiaEurope & Central Asia (excluding high income)Europe & Central Asia (IDA & IBRD countries)European UnionFaroe IslandsFijiFinlandFragile and conflict affected situationsFranceFrench PolynesiaGabonGambia, TheGeorgiaGermanyGhanaGreeceGrenadaGuatemalaGuineaGuinea-BissauGuyanaHaitiHeavily indebted poor countries (HIPC)High incomeHondurasHong Kong SAR, ChinaHungaryIBRD onlyIcelandIDA & IBRD totalIDA onlyIDA totalIndiaIndonesiaIran, Islamic Rep.IraqIrelandIsraelItalyJamaicaJapanJordanKazakhstanKenyaKiribatiKorea, Rep.KosovoKuwaitKyrgyz RepublicLao PDRLate-demographic dividendLatin America & Caribbean Latin America & Caribbean (excluding high income)Latin America & the Caribbean (IDA & IBRD countries)LatviaLeast developed countries: UN classificationLebanonLesothoLiberiaLibyaLithuaniaLow & middle incomeLow incomeLower middle incomeLuxembourgMacao SAR, ChinaMacedonia, FYRMadagascarMalawiMalaysiaMaldivesMaliMaltaMarshall IslandsMauritaniaMauritiusMexicoMicronesia, Fed. Sts.Middle East & North Africa (excluding high income)Middle East & North Africa (IDA & IBRD countries)Middle incomeMoldovaMongoliaMontenegroMoroccoMozambiqueMyanmarNamibiaNepalNetherlandsNew CaledoniaNew ZealandNicaraguaNigerNigeriaNorth AmericaNorwayOECD membersOmanOther small statesPacific island small statesPakistanPalauPanamaPapua New GuineaParaguayPeruPhilippinesPolandPortugalPost-demographic dividendPre-demographic dividendQatarRomaniaRussian FederationRwandaSamoaSao Tome and PrincipeSaudi ArabiaSenegalSerbiaSeychellesSierra LeoneSingaporeSint Maarten (Dutch part)Slovak RepublicSloveniaSmall statesSolomon IslandsSouth AfricaSouth AsiaSouth Asia (IDA & IBRD)South SudanSpainSri LankaSt. Kitts and NevisSt. LuciaSt. Vincent and the GrenadinesSub-Saharan Africa Sub-Saharan Africa (excluding high income)Sub-Saharan Africa (IDA & IBRD countries)SudanSurinameSwazilandSwedenSwitzerlandSyrian Arab RepublicTajikistanTanzaniaThailandTimor-LesteTogoTongaTrinidad and TobagoTunisiaTurkeyTuvaluUgandaUkraineUnited KingdomUnited StatesUpper middle incomeUruguayVanuatuVenezuela, RBWest Bank and GazaWorldYemen, Rep.ZambiaZimbabwe Timeline:
This timeline shows a graph from 1961 to 2016 of South Africa. No data until 1960. Number of actual observations by date: 56.
Source name:
World Development Indicators
Source organization:
International Monetary Fund, Balance of Payments Statistics Yearbook and data files.
Categories, topics:
Economy & Growth, Trade
Last updated:
apr 23, 2017
Indicators value changes by year
Minimum:
46.034
jan 1, 1996
Maximum:
65.966
jan 1, 2004
At the date of observation
Value
Absolute change
Change from previous value
jan 1, 1961
63.128
+63.128
0.0%
jan 1, 1962
64.13
+1.002
1.59%
jan 1, 1963
61.979
-2.151
-3.35%
jan 1, 1964
62.037
+0.058
0.09%
jan 1, 1965
60.633
-1.404
-2.26%
jan 1, 1966
59.829
-0.804
-1.33%
jan 1, 1967
60.0
+0.171
0.29%
jan 1, 1968
57.705
-2.295
-3.83%
jan 1, 1969
55.821
-1.884
-3.26%
jan 1, 1970
56.354
+0.533
0.95%
jan 1, 1971
56.429
+0.075
0.13%
jan 1, 1972
59.045
+2.616
4.64%
jan 1, 1973
56.475
-2.57
-4.35%
jan 1, 1974
57.885
+1.41
2.5%
jan 1, 1975
59.202
+1.317
2.28%
jan 1, 1976
61.04
+1.838
3.1%
jan 1, 1977
58.438
-2.602
-4.26%
jan 1, 1978
58.428
-0.01
-0.02%
jan 1, 1979
56.104
-2.324
-3.98%
jan 1, 1980
55.222
-0.883
-1.57%
jan 1, 1981
56.673
+1.451
2.63%
jan 1, 1982
56.364
-0.309
-0.55%
jan 1, 1983
56.604
+0.239
0.42%
jan 1, 1984
63.887
+7.283
12.87%
jan 1, 1985
62.666
-1.221
-1.91%
jan 1, 1986
54.933
-7.733
-12.34%
jan 1, 1987
53.417
-1.516
-2.76%
jan 1, 1988
58.802
+5.385
10.08%
jan 1, 1989
60.893
+2.092
3.56%
jan 1, 1990
56.473
-4.421
-7.26%
jan 1, 1991
53.446
-3.026
-5.36%
jan 1, 1992
57.94
+4.494
8.41%
jan 1, 1993
54.0
-3.939
-6.8%
jan 1, 1994
56.831
+2.83
5.24%
jan 1, 1995
55.028
-1.803
-3.17%
jan 1, 1996
46.034
-8.994
-16.34%
jan 1, 1997
51.588
+5.554
12.06%
jan 1, 1998
52.844
+1.256
2.44%
jan 1, 1999
52.895
+0.051
0.1%
jan 1, 2000
53.737
+0.842
1.59%
jan 1, 2001
53.047
-0.69
-1.28%
jan 1, 2002
53.021
-0.026
-0.05%
jan 1, 2003
57.196
+4.175
7.87%
jan 1, 2004
65.966
+8.77
15.33%
jan 1, 2005
63.855
-2.111
-3.2%
jan 1, 2006
63.54
-0.315
-0.49%
jan 1, 2007
62.178
-1.362
-2.14%
jan 1, 2008
59.158
-3.02
-4.86%
jan 1, 2009
56.835
-2.323
-3.93%
jan 1, 2010
57.757
+0.922
1.62%
jan 1, 2011
56.557
-1.2
-2.08%
jan 1, 2012
54.853
-1.704
-3.01%
jan 1, 2013
56.667
+1.814
3.31%
jan 1, 2014
54.977
-1.689
-2.98%
jan 1, 2015
55.461
+0.484
0.88%
jan 1, 2016
54.862
-0.6
-1.08%
Ranking of countries by current statistics by years


Comments: