29
/
en
AIzaSyAYiBZKx7MnpbEhh9jyipgxe19OcubqV5w
April 1, 2024
63123
World
WLD
false
2
1
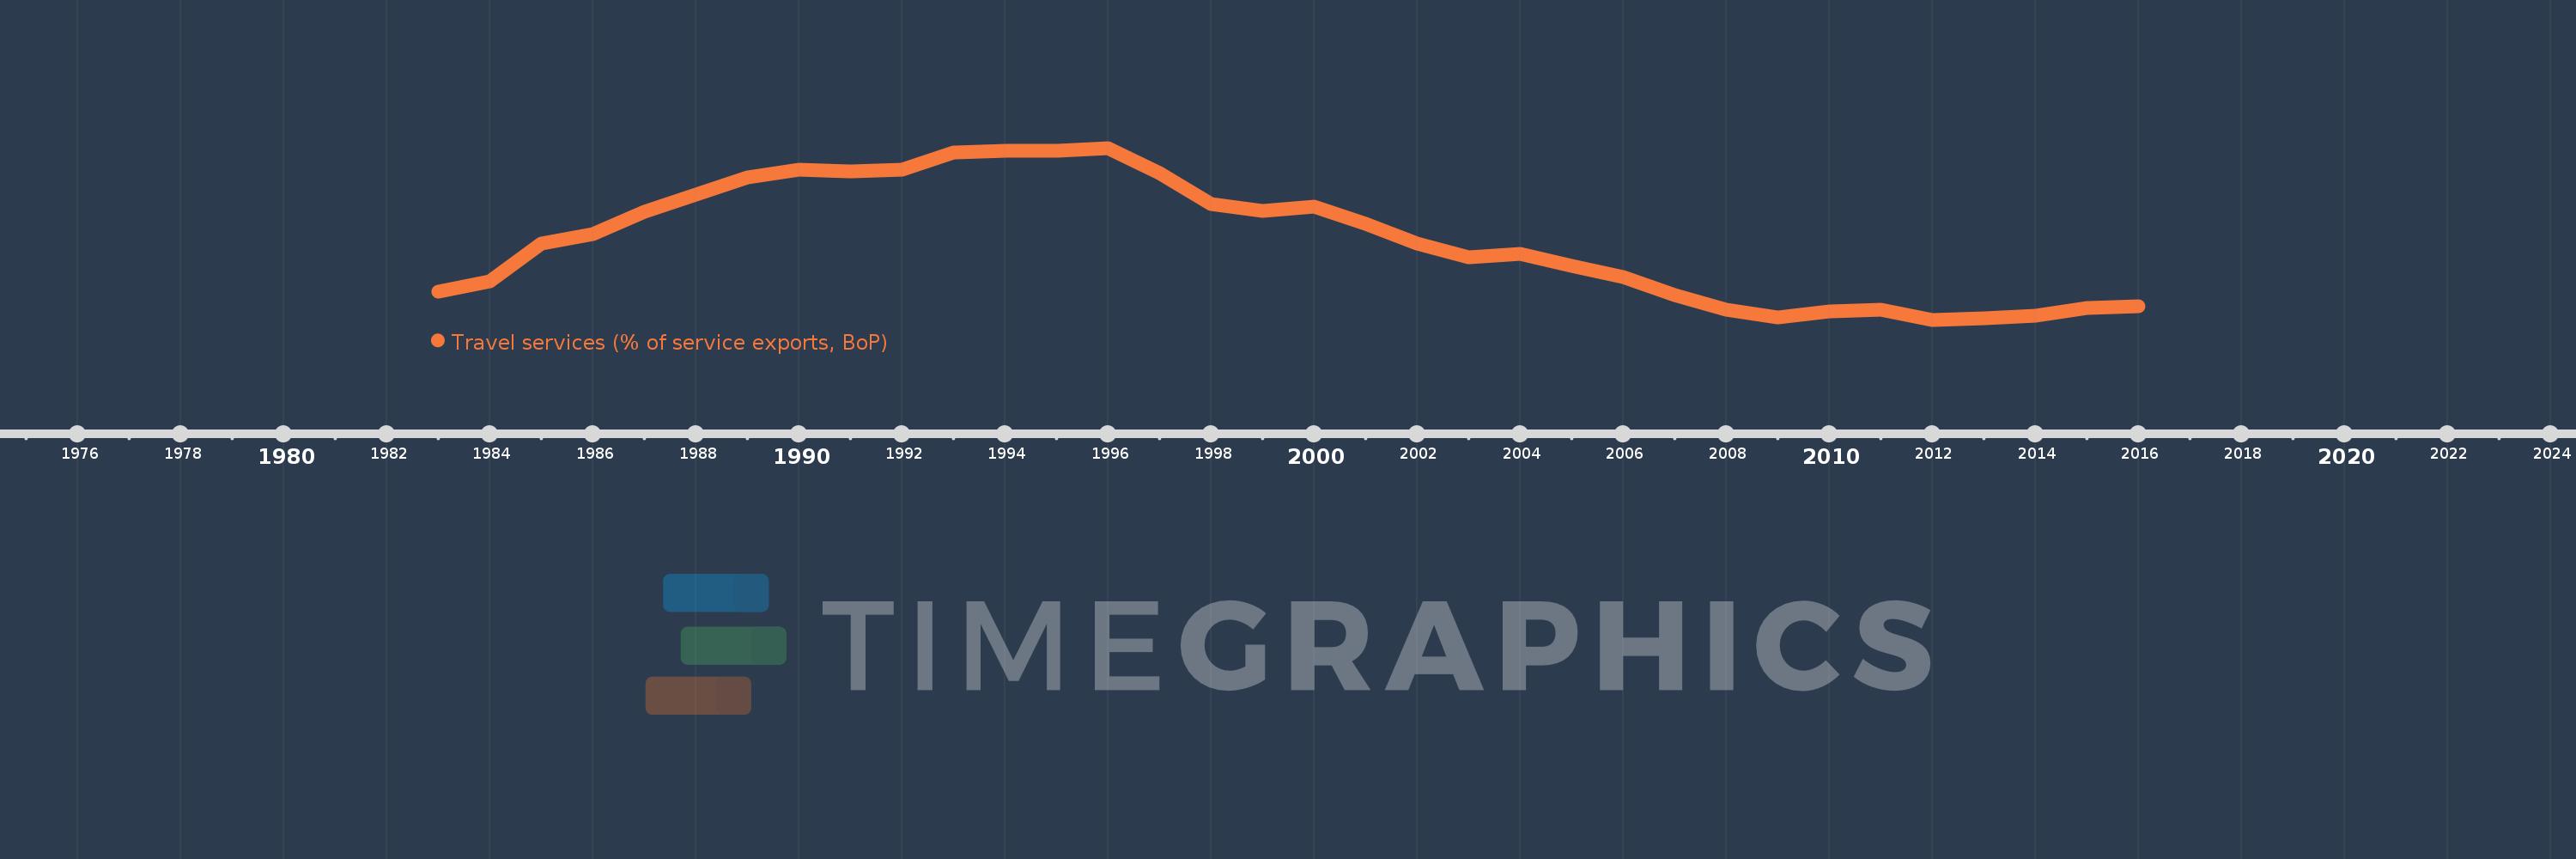
Travel services (% of service exports, BoP)
2016,2015,2014,2013,2012,2011,2010,2009,2008,2007,2006,2005,2004,2003,2002,2001,2000,1999,1998,1997,1996,1995,1994,1993,1992,1991,1990,1989,1988,1987,1986,1985,1984,1983
This statistics in other country:
AfghanistanAlbaniaAlgeriaAngolaAntigua and BarbudaArab WorldArgentinaArmeniaArubaAustraliaAustriaAzerbaijanBahamas, TheBahrainBangladeshBarbadosBelarusBelgiumBelizeBeninBermudaBhutanBoliviaBosnia and HerzegovinaBotswanaBrazilBrunei DarussalamBulgariaBurkina FasoBurundiCabo VerdeCambodiaCameroonCanadaCaribbean small statesCentral African RepublicCentral Europe and the BalticsChadChileChinaColombiaComorosCongo, Dem. Rep.Congo, Rep.Costa RicaCote d'IvoireCroatiaCuracaoCyprusCzech RepublicDenmarkDjiboutiDominicaDominican RepublicEarly-demographic dividendEast Asia & PacificEast Asia & Pacific (excluding high income)East Asia & Pacific (IDA & IBRD countries)EcuadorEgypt, Arab Rep.El SalvadorEritreaEstoniaEthiopiaEuro areaEurope & Central AsiaEurope & Central Asia (excluding high income)Europe & Central Asia (IDA & IBRD countries)European UnionFaroe IslandsFijiFinlandFragile and conflict affected situationsFranceFrench PolynesiaGabonGambia, TheGeorgiaGermanyGhanaGreeceGrenadaGuatemalaGuineaGuinea-BissauGuyanaHaitiHeavily indebted poor countries (HIPC)High incomeHondurasHong Kong SAR, ChinaHungaryIBRD onlyIcelandIDA & IBRD totalIDA onlyIDA totalIndiaIndonesiaIran, Islamic Rep.IraqIrelandIsraelItalyJamaicaJapanJordanKazakhstanKenyaKiribatiKorea, Rep.KosovoKuwaitKyrgyz RepublicLao PDRLate-demographic dividendLatin America & Caribbean Latin America & Caribbean (excluding high income)Latin America & the Caribbean (IDA & IBRD countries)LatviaLeast developed countries: UN classificationLebanonLesothoLiberiaLibyaLithuaniaLow & middle incomeLow incomeLower middle incomeLuxembourgMacao SAR, ChinaMacedonia, FYRMadagascarMalawiMalaysiaMaldivesMaliMaltaMarshall IslandsMauritaniaMauritiusMexicoMicronesia, Fed. Sts.Middle East & North Africa (excluding high income)Middle East & North Africa (IDA & IBRD countries)Middle incomeMoldovaMongoliaMontenegroMoroccoMozambiqueMyanmarNamibiaNepalNetherlandsNew CaledoniaNew ZealandNicaraguaNigerNigeriaNorth AmericaNorwayOECD membersOmanOther small statesPacific island small statesPakistanPalauPanamaPapua New GuineaParaguayPeruPhilippinesPolandPortugalPost-demographic dividendPre-demographic dividendQatarRomaniaRussian FederationRwandaSamoaSao Tome and PrincipeSaudi ArabiaSenegalSerbiaSeychellesSierra LeoneSingaporeSint Maarten (Dutch part)Slovak RepublicSloveniaSmall statesSolomon IslandsSouth AfricaSouth AsiaSouth Asia (IDA & IBRD)South SudanSpainSri LankaSt. Kitts and NevisSt. LuciaSt. Vincent and the GrenadinesSub-Saharan Africa Sub-Saharan Africa (excluding high income)Sub-Saharan Africa (IDA & IBRD countries)SudanSurinameSwazilandSwedenSwitzerlandSyrian Arab RepublicTajikistanTanzaniaThailandTimor-LesteTogoTongaTrinidad and TobagoTunisiaTurkeyTuvaluUgandaUkraineUnited KingdomUnited StatesUpper middle incomeUruguayVanuatuVenezuela, RBWest Bank and GazaWorldYemen, Rep.ZambiaZimbabwe Timeline:
This timeline shows a graph from 1983 to 2016 of World. No data until 1982. Number of actual observations by date: 34.
Source name:
World Development Indicators
Source organization:
International Monetary Fund, Balance of Payments Statistics Yearbook and data files.
Categories, topics:
Economy & Growth, Trade
Last updated:
apr 23, 2017
Indicators value changes by year
Minimum:
24.336
jan 1, 2012
Maximum:
34.191
jan 1, 1996
At the date of observation
Value
Absolute change
Change from previous value
jan 1, 1983
25.954
+25.954
0.0%
jan 1, 1984
26.558
+0.604
2.33%
jan 1, 1985
28.728
+2.17
8.17%
jan 1, 1986
29.236
+0.508
1.77%
jan 1, 1987
30.52
+1.284
4.39%
jan 1, 1988
31.532
+1.012
3.31%
jan 1, 1989
32.507
+0.975
3.09%
jan 1, 1990
32.946
+0.44
1.35%
jan 1, 1991
32.842
-0.104
-0.31%
jan 1, 1992
32.959
+0.116
0.35%
jan 1, 1993
33.943
+0.984
2.99%
jan 1, 1994
34.026
+0.083
0.25%
jan 1, 1995
34.049
+0.023
0.07%
jan 1, 1996
34.191
+0.142
0.42%
jan 1, 1997
32.725
-1.466
-4.29%
jan 1, 1998
30.952
-1.773
-5.42%
jan 1, 1999
30.601
-0.351
-1.13%
jan 1, 2000
30.822
+0.22
0.72%
jan 1, 2001
29.835
-0.986
-3.2%
jan 1, 2002
28.731
-1.104
-3.7%
jan 1, 2003
27.94
-0.791
-2.75%
jan 1, 2004
28.14
+0.2
0.72%
jan 1, 2005
27.421
-0.719
-2.56%
jan 1, 2006
26.782
-0.64
-2.33%
jan 1, 2007
25.763
-1.019
-3.8%
jan 1, 2008
24.937
-0.826
-3.21%
jan 1, 2009
24.465
-0.472
-1.89%
jan 1, 2010
24.815
+0.35
1.43%
jan 1, 2011
24.915
+0.1
0.4%
jan 1, 2012
24.336
-0.579
-2.32%
jan 1, 2013
24.439
+0.104
0.43%
jan 1, 2014
24.544
+0.105
0.43%
jan 1, 2015
25.017
+0.473
1.93%
jan 1, 2016
25.125
+0.108
0.43%
Ranking of countries by current statistics by years


Comments: