29
/
en
AIzaSyAYiBZKx7MnpbEhh9jyipgxe19OcubqV5w
April 1, 2024
55237
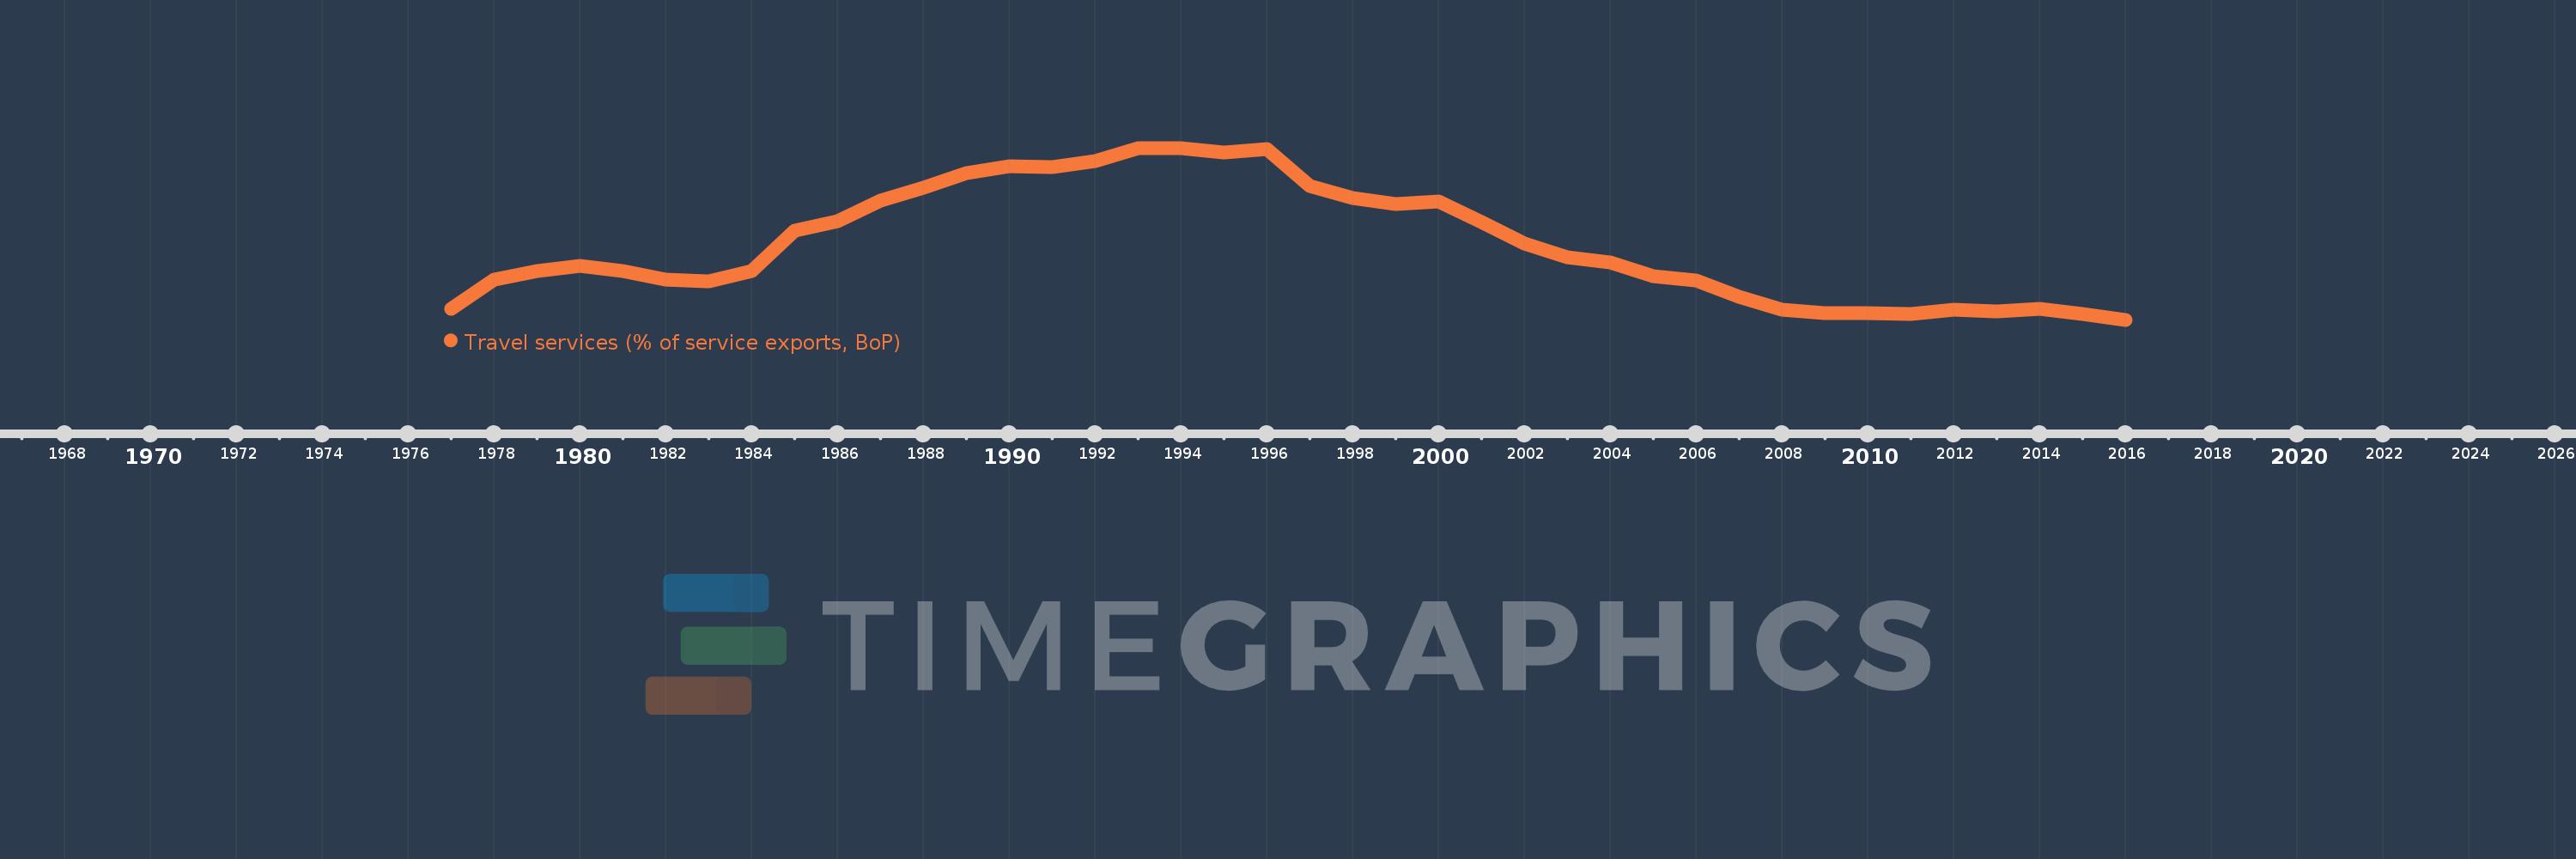
Post-demographic dividend
PST
false
2
1
Travel services (% of service exports, BoP)
2016,2015,2014,2013,2012,2011,2010,2009,2008,2007,2006,2005,2004,2003,2002,2001,2000,1999,1998,1997,1996,1995,1994,1993,1992,1991,1990,1989,1988,1987,1986,1985,1984,1983,1982,1981,1980,1979,1978,1977
This statistics in other country:
AfghanistanAlbaniaAlgeriaAngolaAntigua and BarbudaArab WorldArgentinaArmeniaArubaAustraliaAustriaAzerbaijanBahamas, TheBahrainBangladeshBarbadosBelarusBelgiumBelizeBeninBermudaBhutanBoliviaBosnia and HerzegovinaBotswanaBrazilBrunei DarussalamBulgariaBurkina FasoBurundiCabo VerdeCambodiaCameroonCanadaCaribbean small statesCentral African RepublicCentral Europe and the BalticsChadChileChinaColombiaComorosCongo, Dem. Rep.Congo, Rep.Costa RicaCote d'IvoireCroatiaCuracaoCyprusCzech RepublicDenmarkDjiboutiDominicaDominican RepublicEarly-demographic dividendEast Asia & PacificEast Asia & Pacific (excluding high income)East Asia & Pacific (IDA & IBRD countries)EcuadorEgypt, Arab Rep.El SalvadorEritreaEstoniaEthiopiaEuro areaEurope & Central AsiaEurope & Central Asia (excluding high income)Europe & Central Asia (IDA & IBRD countries)European UnionFaroe IslandsFijiFinlandFragile and conflict affected situationsFranceFrench PolynesiaGabonGambia, TheGeorgiaGermanyGhanaGreeceGrenadaGuatemalaGuineaGuinea-BissauGuyanaHaitiHeavily indebted poor countries (HIPC)High incomeHondurasHong Kong SAR, ChinaHungaryIBRD onlyIcelandIDA & IBRD totalIDA onlyIDA totalIndiaIndonesiaIran, Islamic Rep.IraqIrelandIsraelItalyJamaicaJapanJordanKazakhstanKenyaKiribatiKorea, Rep.KosovoKuwaitKyrgyz RepublicLao PDRLate-demographic dividendLatin America & Caribbean Latin America & Caribbean (excluding high income)Latin America & the Caribbean (IDA & IBRD countries)LatviaLeast developed countries: UN classificationLebanonLesothoLiberiaLibyaLithuaniaLow & middle incomeLow incomeLower middle incomeLuxembourgMacao SAR, ChinaMacedonia, FYRMadagascarMalawiMalaysiaMaldivesMaliMaltaMarshall IslandsMauritaniaMauritiusMexicoMicronesia, Fed. Sts.Middle East & North Africa (excluding high income)Middle East & North Africa (IDA & IBRD countries)Middle incomeMoldovaMongoliaMontenegroMoroccoMozambiqueMyanmarNamibiaNepalNetherlandsNew CaledoniaNew ZealandNicaraguaNigerNigeriaNorth AmericaNorwayOECD membersOmanOther small statesPacific island small statesPakistanPalauPanamaPapua New GuineaParaguayPeruPhilippinesPolandPortugalPost-demographic dividendPre-demographic dividendQatarRomaniaRussian FederationRwandaSamoaSao Tome and PrincipeSaudi ArabiaSenegalSerbiaSeychellesSierra LeoneSingaporeSint Maarten (Dutch part)Slovak RepublicSloveniaSmall statesSolomon IslandsSouth AfricaSouth AsiaSouth Asia (IDA & IBRD)South SudanSpainSri LankaSt. Kitts and NevisSt. LuciaSt. Vincent and the GrenadinesSub-Saharan Africa Sub-Saharan Africa (excluding high income)Sub-Saharan Africa (IDA & IBRD countries)SudanSurinameSwazilandSwedenSwitzerlandSyrian Arab RepublicTajikistanTanzaniaThailandTimor-LesteTogoTongaTrinidad and TobagoTunisiaTurkeyTuvaluUgandaUkraineUnited KingdomUnited StatesUpper middle incomeUruguayVanuatuVenezuela, RBWest Bank and GazaWorldYemen, Rep.ZambiaZimbabwe Timeline:
This timeline shows a graph from 1977 to 2016 of Post-demographic dividend. No data until 1976. Number of actual observations by date: 40.
Source name:
World Development Indicators
Source organization:
International Monetary Fund, Balance of Payments Statistics Yearbook and data files.
Categories, topics:
Economy & Growth, Trade
Last updated:
apr 23, 2017
Indicators value changes by year
Minimum:
21.914
jan 1, 2016
Maximum:
32.882
jan 1, 1994
At the date of observation
Value
Absolute change
Change from previous value
jan 1, 1977
22.591
+22.591
0.0%
jan 1, 1978
24.463
+1.871
8.28%
jan 1, 1979
25.042
+0.579
2.37%
jan 1, 1980
25.371
+0.329
1.31%
jan 1, 1981
25.034
-0.336
-1.33%
jan 1, 1982
24.467
-0.567
-2.26%
jan 1, 1983
24.383
-0.084
-0.34%
jan 1, 1984
25.019
+0.635
2.61%
jan 1, 1985
27.586
+2.567
10.26%
jan 1, 1986
28.213
+0.627
2.27%
jan 1, 1987
29.508
+1.295
4.59%
jan 1, 1988
30.331
+0.823
2.79%
jan 1, 1989
31.254
+0.923
3.04%
jan 1, 1990
31.704
+0.45
1.44%
jan 1, 1991
31.633
-0.071
-0.22%
jan 1, 1992
32.018
+0.384
1.21%
jan 1, 1993
32.847
+0.829
2.59%
jan 1, 1994
32.882
+0.036
0.11%
jan 1, 1995
32.596
-0.287
-0.87%
jan 1, 1996
32.796
+0.2
0.61%
jan 1, 1997
30.475
-2.321
-7.08%
jan 1, 1998
29.679
-0.796
-2.61%
jan 1, 1999
29.313
-0.365
-1.23%
jan 1, 2000
29.466
+0.153
0.52%
jan 1, 2001
28.16
-1.307
-4.43%
jan 1, 2002
26.771
-1.388
-4.93%
jan 1, 2003
25.923
-0.848
-3.17%
jan 1, 2004
25.562
-0.361
-1.39%
jan 1, 2005
24.716
-0.846
-3.31%
jan 1, 2006
24.446
-0.27
-1.09%
jan 1, 2007
23.396
-1.05
-4.29%
jan 1, 2008
22.576
-0.82
-3.5%
jan 1, 2009
22.361
-0.215
-0.95%
jan 1, 2010
22.341
-0.021
-0.09%
jan 1, 2011
22.264
-0.077
-0.34%
jan 1, 2012
22.563
+0.299
1.34%
jan 1, 2013
22.447
-0.116
-0.51%
jan 1, 2014
22.597
+0.151
0.67%
jan 1, 2015
22.307
-0.291
-1.29%
jan 1, 2016
21.914
-0.392
-1.76%
Ranking of countries by current statistics by years


Comments: