29
/
en
AIzaSyAYiBZKx7MnpbEhh9jyipgxe19OcubqV5w
April 1, 2024
51585
Middle income
MIC
false
2
1
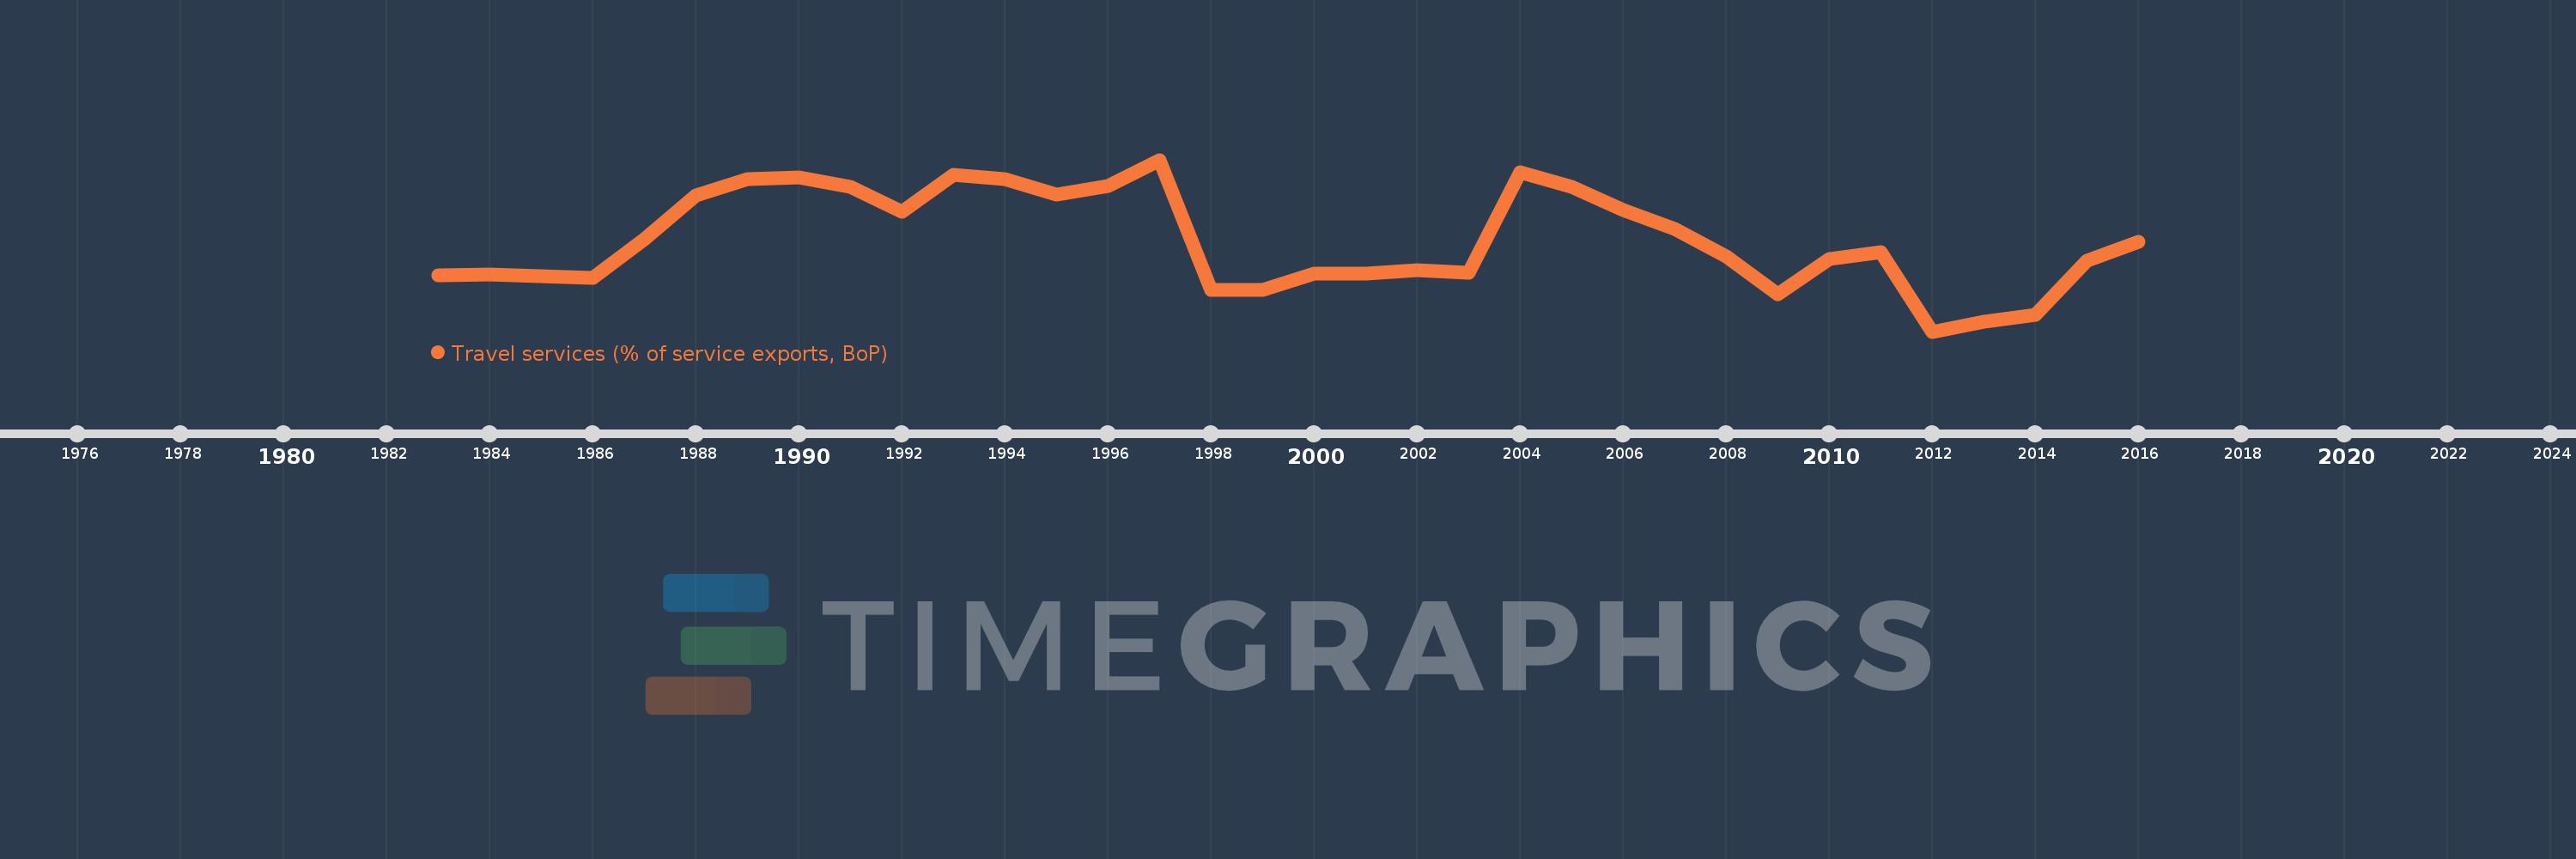
Travel services (% of service exports, BoP)
2016,2015,2014,2013,2012,2011,2010,2009,2008,2007,2006,2005,2004,2003,2002,2001,2000,1999,1998,1997,1996,1995,1994,1993,1992,1991,1990,1989,1988,1987,1986,1985,1984,1983
This statistics in other country:
AfghanistanAlbaniaAlgeriaAngolaAntigua and BarbudaArab WorldArgentinaArmeniaArubaAustraliaAustriaAzerbaijanBahamas, TheBahrainBangladeshBarbadosBelarusBelgiumBelizeBeninBermudaBhutanBoliviaBosnia and HerzegovinaBotswanaBrazilBrunei DarussalamBulgariaBurkina FasoBurundiCabo VerdeCambodiaCameroonCanadaCaribbean small statesCentral African RepublicCentral Europe and the BalticsChadChileChinaColombiaComorosCongo, Dem. Rep.Congo, Rep.Costa RicaCote d'IvoireCroatiaCuracaoCyprusCzech RepublicDenmarkDjiboutiDominicaDominican RepublicEarly-demographic dividendEast Asia & PacificEast Asia & Pacific (excluding high income)East Asia & Pacific (IDA & IBRD countries)EcuadorEgypt, Arab Rep.El SalvadorEritreaEstoniaEthiopiaEuro areaEurope & Central AsiaEurope & Central Asia (excluding high income)Europe & Central Asia (IDA & IBRD countries)European UnionFaroe IslandsFijiFinlandFragile and conflict affected situationsFranceFrench PolynesiaGabonGambia, TheGeorgiaGermanyGhanaGreeceGrenadaGuatemalaGuineaGuinea-BissauGuyanaHaitiHeavily indebted poor countries (HIPC)High incomeHondurasHong Kong SAR, ChinaHungaryIBRD onlyIcelandIDA & IBRD totalIDA onlyIDA totalIndiaIndonesiaIran, Islamic Rep.IraqIrelandIsraelItalyJamaicaJapanJordanKazakhstanKenyaKiribatiKorea, Rep.KosovoKuwaitKyrgyz RepublicLao PDRLate-demographic dividendLatin America & Caribbean Latin America & Caribbean (excluding high income)Latin America & the Caribbean (IDA & IBRD countries)LatviaLeast developed countries: UN classificationLebanonLesothoLiberiaLibyaLithuaniaLow & middle incomeLow incomeLower middle incomeLuxembourgMacao SAR, ChinaMacedonia, FYRMadagascarMalawiMalaysiaMaldivesMaliMaltaMarshall IslandsMauritaniaMauritiusMexicoMicronesia, Fed. Sts.Middle East & North Africa (excluding high income)Middle East & North Africa (IDA & IBRD countries)Middle incomeMoldovaMongoliaMontenegroMoroccoMozambiqueMyanmarNamibiaNepalNetherlandsNew CaledoniaNew ZealandNicaraguaNigerNigeriaNorth AmericaNorwayOECD membersOmanOther small statesPacific island small statesPakistanPalauPanamaPapua New GuineaParaguayPeruPhilippinesPolandPortugalPost-demographic dividendPre-demographic dividendQatarRomaniaRussian FederationRwandaSamoaSao Tome and PrincipeSaudi ArabiaSenegalSerbiaSeychellesSierra LeoneSingaporeSint Maarten (Dutch part)Slovak RepublicSloveniaSmall statesSolomon IslandsSouth AfricaSouth AsiaSouth Asia (IDA & IBRD)South SudanSpainSri LankaSt. Kitts and NevisSt. LuciaSt. Vincent and the GrenadinesSub-Saharan Africa Sub-Saharan Africa (excluding high income)Sub-Saharan Africa (IDA & IBRD countries)SudanSurinameSwazilandSwedenSwitzerlandSyrian Arab RepublicTajikistanTanzaniaThailandTimor-LesteTogoTongaTrinidad and TobagoTunisiaTurkeyTuvaluUgandaUkraineUnited KingdomUnited StatesUpper middle incomeUruguayVanuatuVenezuela, RBWest Bank and GazaWorldYemen, Rep.ZambiaZimbabwe Timeline:
This timeline shows a graph from 1983 to 2016 of Middle income. No data until 1982. Number of actual observations by date: 34.
Source name:
World Development Indicators
Source organization:
International Monetary Fund, Balance of Payments Statistics Yearbook and data files.
Categories, topics:
Economy & Growth, Trade
Last updated:
apr 23, 2017
Indicators value changes by year
Minimum:
32.115
jan 1, 2012
At the date of observation
Value
Absolute change
Change from previous value
jan 1, 1983
35.255
+35.255
0.0%
jan 1, 1984
35.319
+0.064
0.18%
jan 1, 1985
35.202
-0.117
-0.33%
jan 1, 1986
35.119
-0.083
-0.24%
jan 1, 1987
37.25
+2.131
6.07%
jan 1, 1988
39.711
+2.461
6.61%
jan 1, 1989
40.639
+0.928
2.34%
jan 1, 1990
40.73
+0.091
0.22%
jan 1, 1991
40.189
-0.541
-1.33%
jan 1, 1992
38.803
-1.386
-3.45%
jan 1, 1993
40.864
+2.061
5.31%
jan 1, 1994
40.612
-0.252
-0.62%
jan 1, 1995
39.742
-0.87
-2.14%
jan 1, 1996
40.23
+0.488
1.23%
jan 1, 1997
41.7
+1.47
3.65%
jan 1, 1998
34.429
-7.272
-17.44%
jan 1, 1999
34.438
+0.01
0.03%
jan 1, 2000
35.366
+0.927
2.69%
jan 1, 2001
35.345
-0.021
-0.06%
jan 1, 2002
35.547
+0.203
0.57%
jan 1, 2003
35.414
-0.133
-0.38%
jan 1, 2004
40.985
+5.571
15.73%
jan 1, 2005
40.169
-0.816
-1.99%
jan 1, 2006
38.914
-1.255
-3.13%
jan 1, 2007
37.847
-1.067
-2.74%
jan 1, 2008
36.325
-1.522
-4.02%
jan 1, 2009
34.18
-2.145
-5.9%
jan 1, 2010
36.166
+1.986
5.81%
jan 1, 2011
36.552
+0.386
1.07%
jan 1, 2012
32.115
-4.437
-12.14%
jan 1, 2013
32.679
+0.563
1.75%
jan 1, 2014
33.026
+0.348
1.06%
jan 1, 2015
36.087
+3.06
9.27%
jan 1, 2016
37.101
+1.015
2.81%
Ranking of countries by current statistics by years


Comments: