29
/
en
AIzaSyAYiBZKx7MnpbEhh9jyipgxe19OcubqV5w
April 1, 2024
161095
Israel
ISR
true
2
1
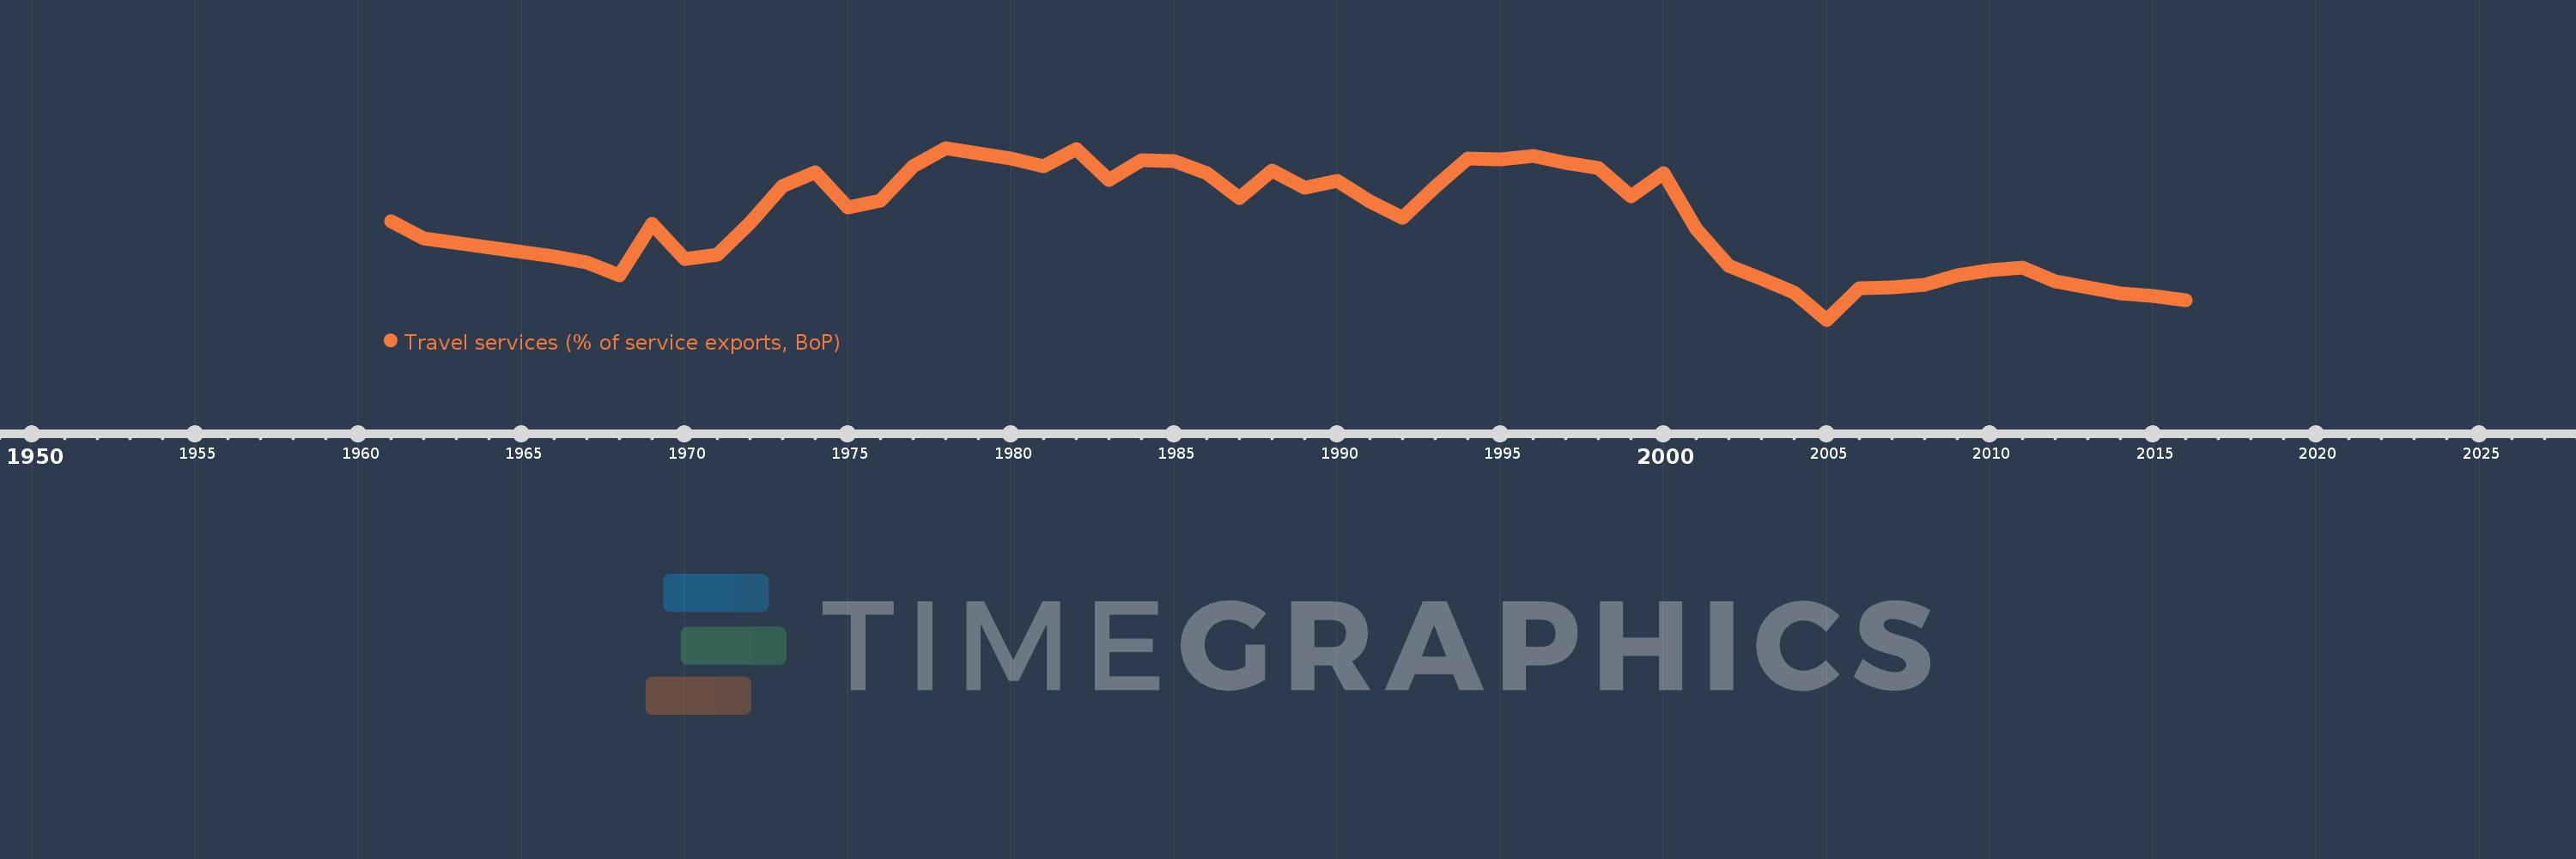
Travel services (% of service exports, BoP)
2016,2015,2014,2013,2012,2011,2010,2009,2008,2007,2006,2005,2004,2003,2002,2001,2000,1999,1998,1997,1996,1995,1994,1993,1992,1991,1990,1989,1988,1987,1986,1985,1984,1983,1982,1981,1980,1979,1978,1977,1976,1975,1974,1973,1972,1971,1970,1969,1968,1967,1966,1962,1961
This statistics in other country:
AfghanistanAlbaniaAlgeriaAngolaAntigua and BarbudaArab WorldArgentinaArmeniaArubaAustraliaAustriaAzerbaijanBahamas, TheBahrainBangladeshBarbadosBelarusBelgiumBelizeBeninBermudaBhutanBoliviaBosnia and HerzegovinaBotswanaBrazilBrunei DarussalamBulgariaBurkina FasoBurundiCabo VerdeCambodiaCameroonCanadaCaribbean small statesCentral African RepublicCentral Europe and the BalticsChadChileChinaColombiaComorosCongo, Dem. Rep.Congo, Rep.Costa RicaCote d'IvoireCroatiaCuracaoCyprusCzech RepublicDenmarkDjiboutiDominicaDominican RepublicEarly-demographic dividendEast Asia & PacificEast Asia & Pacific (excluding high income)East Asia & Pacific (IDA & IBRD countries)EcuadorEgypt, Arab Rep.El SalvadorEritreaEstoniaEthiopiaEuro areaEurope & Central AsiaEurope & Central Asia (excluding high income)Europe & Central Asia (IDA & IBRD countries)European UnionFaroe IslandsFijiFinlandFragile and conflict affected situationsFranceFrench PolynesiaGabonGambia, TheGeorgiaGermanyGhanaGreeceGrenadaGuatemalaGuineaGuinea-BissauGuyanaHaitiHeavily indebted poor countries (HIPC)High incomeHondurasHong Kong SAR, ChinaHungaryIBRD onlyIcelandIDA & IBRD totalIDA onlyIDA totalIndiaIndonesiaIran, Islamic Rep.IraqIrelandIsraelItalyJamaicaJapanJordanKazakhstanKenyaKiribatiKorea, Rep.KosovoKuwaitKyrgyz RepublicLao PDRLate-demographic dividendLatin America & Caribbean Latin America & Caribbean (excluding high income)Latin America & the Caribbean (IDA & IBRD countries)LatviaLeast developed countries: UN classificationLebanonLesothoLiberiaLibyaLithuaniaLow & middle incomeLow incomeLower middle incomeLuxembourgMacao SAR, ChinaMacedonia, FYRMadagascarMalawiMalaysiaMaldivesMaliMaltaMarshall IslandsMauritaniaMauritiusMexicoMicronesia, Fed. Sts.Middle East & North Africa (excluding high income)Middle East & North Africa (IDA & IBRD countries)Middle incomeMoldovaMongoliaMontenegroMoroccoMozambiqueMyanmarNamibiaNepalNetherlandsNew CaledoniaNew ZealandNicaraguaNigerNigeriaNorth AmericaNorwayOECD membersOmanOther small statesPacific island small statesPakistanPalauPanamaPapua New GuineaParaguayPeruPhilippinesPolandPortugalPost-demographic dividendPre-demographic dividendQatarRomaniaRussian FederationRwandaSamoaSao Tome and PrincipeSaudi ArabiaSenegalSerbiaSeychellesSierra LeoneSingaporeSint Maarten (Dutch part)Slovak RepublicSloveniaSmall statesSolomon IslandsSouth AfricaSouth AsiaSouth Asia (IDA & IBRD)South SudanSpainSri LankaSt. Kitts and NevisSt. LuciaSt. Vincent and the GrenadinesSub-Saharan Africa Sub-Saharan Africa (excluding high income)Sub-Saharan Africa (IDA & IBRD countries)SudanSurinameSwazilandSwedenSwitzerlandSyrian Arab RepublicTajikistanTanzaniaThailandTimor-LesteTogoTongaTrinidad and TobagoTunisiaTurkeyTuvaluUgandaUkraineUnited KingdomUnited StatesUpper middle incomeUruguayVanuatuVenezuela, RBWest Bank and GazaWorldYemen, Rep.ZambiaZimbabwe Timeline:
This timeline shows a graph from 1961 to 2016 of Israel. No data until 1960. Number of actual observations by date: 53.
Source name:
World Development Indicators
Source organization:
International Monetary Fund, Balance of Payments Statistics Yearbook and data files.
Categories, topics:
Economy & Growth, Trade
Last updated:
apr 23, 2017
Indicators value changes by year
Minimum:
11.989
jan 1, 2005
Maximum:
38.917
jan 1, 1978
At the date of observation
Value
Absolute change
Change from previous value
jan 1, 1961
27.368
+27.368
0.0%
jan 1, 1962
24.793
-2.575
-9.41%
jan 1, 1966
21.97
-2.824
-11.39%
jan 1, 1967
20.93
-1.039
-4.73%
jan 1, 1968
18.927
-2.003
-9.57%
jan 1, 1969
27.059
+8.131
42.96%
jan 1, 1970
21.538
-5.52
-20.4%
jan 1, 1971
22.177
+0.639
2.97%
jan 1, 1972
27.208
+5.031
22.68%
jan 1, 1973
33.012
+5.804
21.33%
jan 1, 1974
35.142
+2.129
6.45%
jan 1, 1975
29.649
-5.492
-15.63%
jan 1, 1976
30.639
+0.99
3.34%
jan 1, 1977
36.024
+5.384
17.57%
jan 1, 1978
38.917
+2.893
8.03%
jan 1, 1979
38.025
-0.892
-2.29%
jan 1, 1980
37.274
-0.751
-1.98%
jan 1, 1981
36.003
-1.271
-3.41%
jan 1, 1982
38.736
+2.733
7.59%
jan 1, 1983
33.924
-4.812
-12.42%
jan 1, 1984
36.975
+3.052
9.0%
jan 1, 1985
36.911
-0.064
-0.17%
jan 1, 1986
34.946
-1.965
-5.32%
jan 1, 1987
31.13
-3.816
-10.92%
jan 1, 1988
35.324
+4.193
13.47%
jan 1, 1989
32.654
-2.67
-7.56%
jan 1, 1990
33.757
+1.103
3.38%
jan 1, 1991
30.565
-3.191
-9.45%
jan 1, 1992
27.911
-2.654
-8.68%
jan 1, 1993
32.885
+4.974
17.82%
jan 1, 1994
37.32
+4.435
13.49%
jan 1, 1995
37.083
-0.237
-0.63%
jan 1, 1996
37.629
+0.546
1.47%
jan 1, 1997
36.575
-1.054
-2.8%
jan 1, 1998
35.826
-0.75
-2.05%
jan 1, 1999
31.271
-4.554
-12.71%
jan 1, 2000
34.957
+3.686
11.79%
jan 1, 2001
26.199
-8.758
-25.05%
jan 1, 2002
20.462
-5.737
-21.9%
jan 1, 2003
18.382
-2.08
-10.17%
jan 1, 2004
16.279
-2.102
-11.44%
jan 1, 2005
11.989
-4.29
-26.35%
jan 1, 2006
16.983
+4.993
41.65%
jan 1, 2007
17.113
+0.13
0.77%
jan 1, 2008
17.528
+0.415
2.43%
jan 1, 2009
19.009
+1.481
8.45%
jan 1, 2010
19.721
+0.712
3.74%
jan 1, 2011
20.127
+0.406
2.06%
jan 1, 2012
18.053
-2.073
-10.3%
jan 1, 2013
17.116
-0.937
-5.19%
jan 1, 2014
16.167
-0.949
-5.54%
jan 1, 2015
15.769
-0.398
-2.46%
jan 1, 2016
15.065
-0.704
-4.47%
Ranking of countries by current statistics by years


Comments: