29
/
en
AIzaSyAYiBZKx7MnpbEhh9jyipgxe19OcubqV5w
April 1, 2024
94369
Bulgaria
BGR
true
2
1
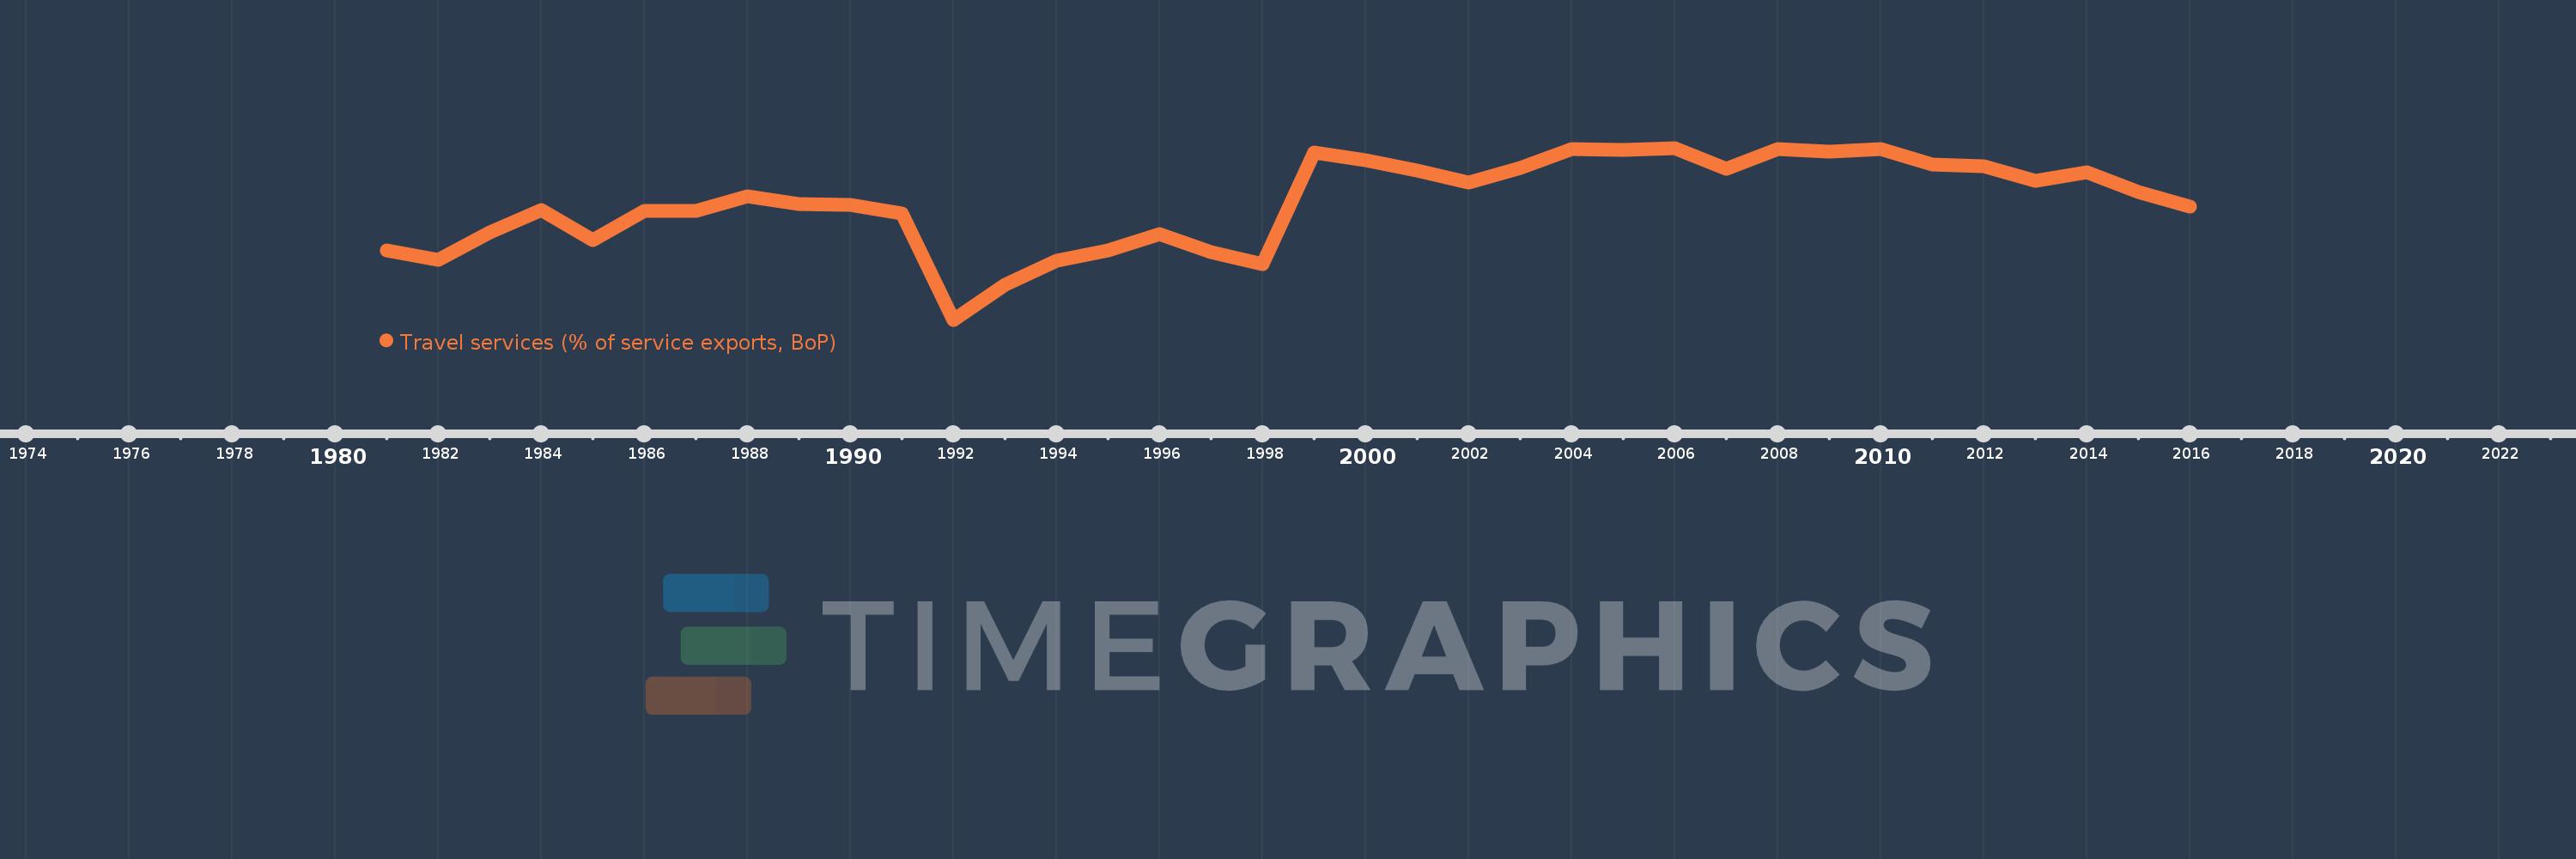
Travel services (% of service exports, BoP)
2016,2015,2014,2013,2012,2011,2010,2009,2008,2007,2006,2005,2004,2003,2002,2001,2000,1999,1998,1997,1996,1995,1994,1993,1992,1991,1990,1989,1988,1987,1986,1985,1984,1983,1982,1981
This statistics in other country:
AfghanistanAlbaniaAlgeriaAngolaAntigua and BarbudaArab WorldArgentinaArmeniaArubaAustraliaAustriaAzerbaijanBahamas, TheBahrainBangladeshBarbadosBelarusBelgiumBelizeBeninBermudaBhutanBoliviaBosnia and HerzegovinaBotswanaBrazilBrunei DarussalamBulgariaBurkina FasoBurundiCabo VerdeCambodiaCameroonCanadaCaribbean small statesCentral African RepublicCentral Europe and the BalticsChadChileChinaColombiaComorosCongo, Dem. Rep.Congo, Rep.Costa RicaCote d'IvoireCroatiaCuracaoCyprusCzech RepublicDenmarkDjiboutiDominicaDominican RepublicEarly-demographic dividendEast Asia & PacificEast Asia & Pacific (excluding high income)East Asia & Pacific (IDA & IBRD countries)EcuadorEgypt, Arab Rep.El SalvadorEritreaEstoniaEthiopiaEuro areaEurope & Central AsiaEurope & Central Asia (excluding high income)Europe & Central Asia (IDA & IBRD countries)European UnionFaroe IslandsFijiFinlandFragile and conflict affected situationsFranceFrench PolynesiaGabonGambia, TheGeorgiaGermanyGhanaGreeceGrenadaGuatemalaGuineaGuinea-BissauGuyanaHaitiHeavily indebted poor countries (HIPC)High incomeHondurasHong Kong SAR, ChinaHungaryIBRD onlyIcelandIDA & IBRD totalIDA onlyIDA totalIndiaIndonesiaIran, Islamic Rep.IraqIrelandIsraelItalyJamaicaJapanJordanKazakhstanKenyaKiribatiKorea, Rep.KosovoKuwaitKyrgyz RepublicLao PDRLate-demographic dividendLatin America & Caribbean Latin America & Caribbean (excluding high income)Latin America & the Caribbean (IDA & IBRD countries)LatviaLeast developed countries: UN classificationLebanonLesothoLiberiaLibyaLithuaniaLow & middle incomeLow incomeLower middle incomeLuxembourgMacao SAR, ChinaMacedonia, FYRMadagascarMalawiMalaysiaMaldivesMaliMaltaMarshall IslandsMauritaniaMauritiusMexicoMicronesia, Fed. Sts.Middle East & North Africa (excluding high income)Middle East & North Africa (IDA & IBRD countries)Middle incomeMoldovaMongoliaMontenegroMoroccoMozambiqueMyanmarNamibiaNepalNetherlandsNew CaledoniaNew ZealandNicaraguaNigerNigeriaNorth AmericaNorwayOECD membersOmanOther small statesPacific island small statesPakistanPalauPanamaPapua New GuineaParaguayPeruPhilippinesPolandPortugalPost-demographic dividendPre-demographic dividendQatarRomaniaRussian FederationRwandaSamoaSao Tome and PrincipeSaudi ArabiaSenegalSerbiaSeychellesSierra LeoneSingaporeSint Maarten (Dutch part)Slovak RepublicSloveniaSmall statesSolomon IslandsSouth AfricaSouth AsiaSouth Asia (IDA & IBRD)South SudanSpainSri LankaSt. Kitts and NevisSt. LuciaSt. Vincent and the GrenadinesSub-Saharan Africa Sub-Saharan Africa (excluding high income)Sub-Saharan Africa (IDA & IBRD countries)SudanSurinameSwazilandSwedenSwitzerlandSyrian Arab RepublicTajikistanTanzaniaThailandTimor-LesteTogoTongaTrinidad and TobagoTunisiaTurkeyTuvaluUgandaUkraineUnited KingdomUnited StatesUpper middle incomeUruguayVanuatuVenezuela, RBWest Bank and GazaWorldYemen, Rep.ZambiaZimbabwe Timeline:
This timeline shows a graph from 1981 to 2016 of Bulgaria. No data until 1980. Number of actual observations by date: 36.
Source name:
World Development Indicators
Source organization:
International Monetary Fund, Balance of Payments Statistics Yearbook and data files.
Categories, topics:
Economy & Growth, Trade
Last updated:
apr 23, 2017
Indicators value changes by year
Minimum:
10.928
jan 1, 1992
Maximum:
55.223
jan 1, 2006
At the date of observation
Value
Absolute change
Change from previous value
jan 1, 1981
28.737
+28.737
0.0%
jan 1, 1982
26.402
-2.335
-8.12%
jan 1, 1983
33.471
+7.07
26.78%
jan 1, 1984
39.188
+5.716
17.08%
jan 1, 1985
31.422
-7.766
-19.82%
jan 1, 1986
39.064
+7.642
24.32%
jan 1, 1987
39.04
-0.024
-0.06%
jan 1, 1988
42.66
+3.62
9.27%
jan 1, 1989
40.809
-1.85
-4.34%
jan 1, 1990
40.474
-0.335
-0.82%
jan 1, 1991
38.232
-2.242
-5.54%
jan 1, 1992
10.928
-27.304
-71.42%
jan 1, 1993
20.041
+9.113
83.4%
jan 1, 1994
26.244
+6.203
30.95%
jan 1, 1995
28.769
+2.525
9.62%
jan 1, 1996
33.017
+4.247
14.76%
jan 1, 1997
28.433
-4.583
-13.88%
jan 1, 1998
25.267
-3.166
-11.14%
jan 1, 1999
54.049
+28.782
113.91%
jan 1, 2000
52.097
-1.952
-3.61%
jan 1, 2001
49.385
-2.712
-5.2%
jan 1, 2002
46.368
-3.017
-6.11%
jan 1, 2003
50.064
+3.696
7.97%
jan 1, 2004
54.837
+4.773
9.53%
jan 1, 2005
54.772
-0.065
-0.12%
jan 1, 2006
55.223
+0.451
0.82%
jan 1, 2007
49.873
-5.35
-9.69%
jan 1, 2008
54.882
+5.009
10.04%
jan 1, 2009
54.215
-0.667
-1.22%
jan 1, 2010
54.84
+0.625
1.15%
jan 1, 2011
50.94
-3.9
-7.11%
jan 1, 2012
50.422
-0.518
-1.02%
jan 1, 2013
46.774
-3.648
-7.24%
jan 1, 2014
49.032
+2.258
4.83%
jan 1, 2015
43.831
-5.202
-10.61%
jan 1, 2016
40.122
-3.708
-8.46%
Ranking of countries by current statistics by years


Comments: