29
/
en
AIzaSyAYiBZKx7MnpbEhh9jyipgxe19OcubqV5w
April 1, 2024
266435
Tonga
TON
true
2
1
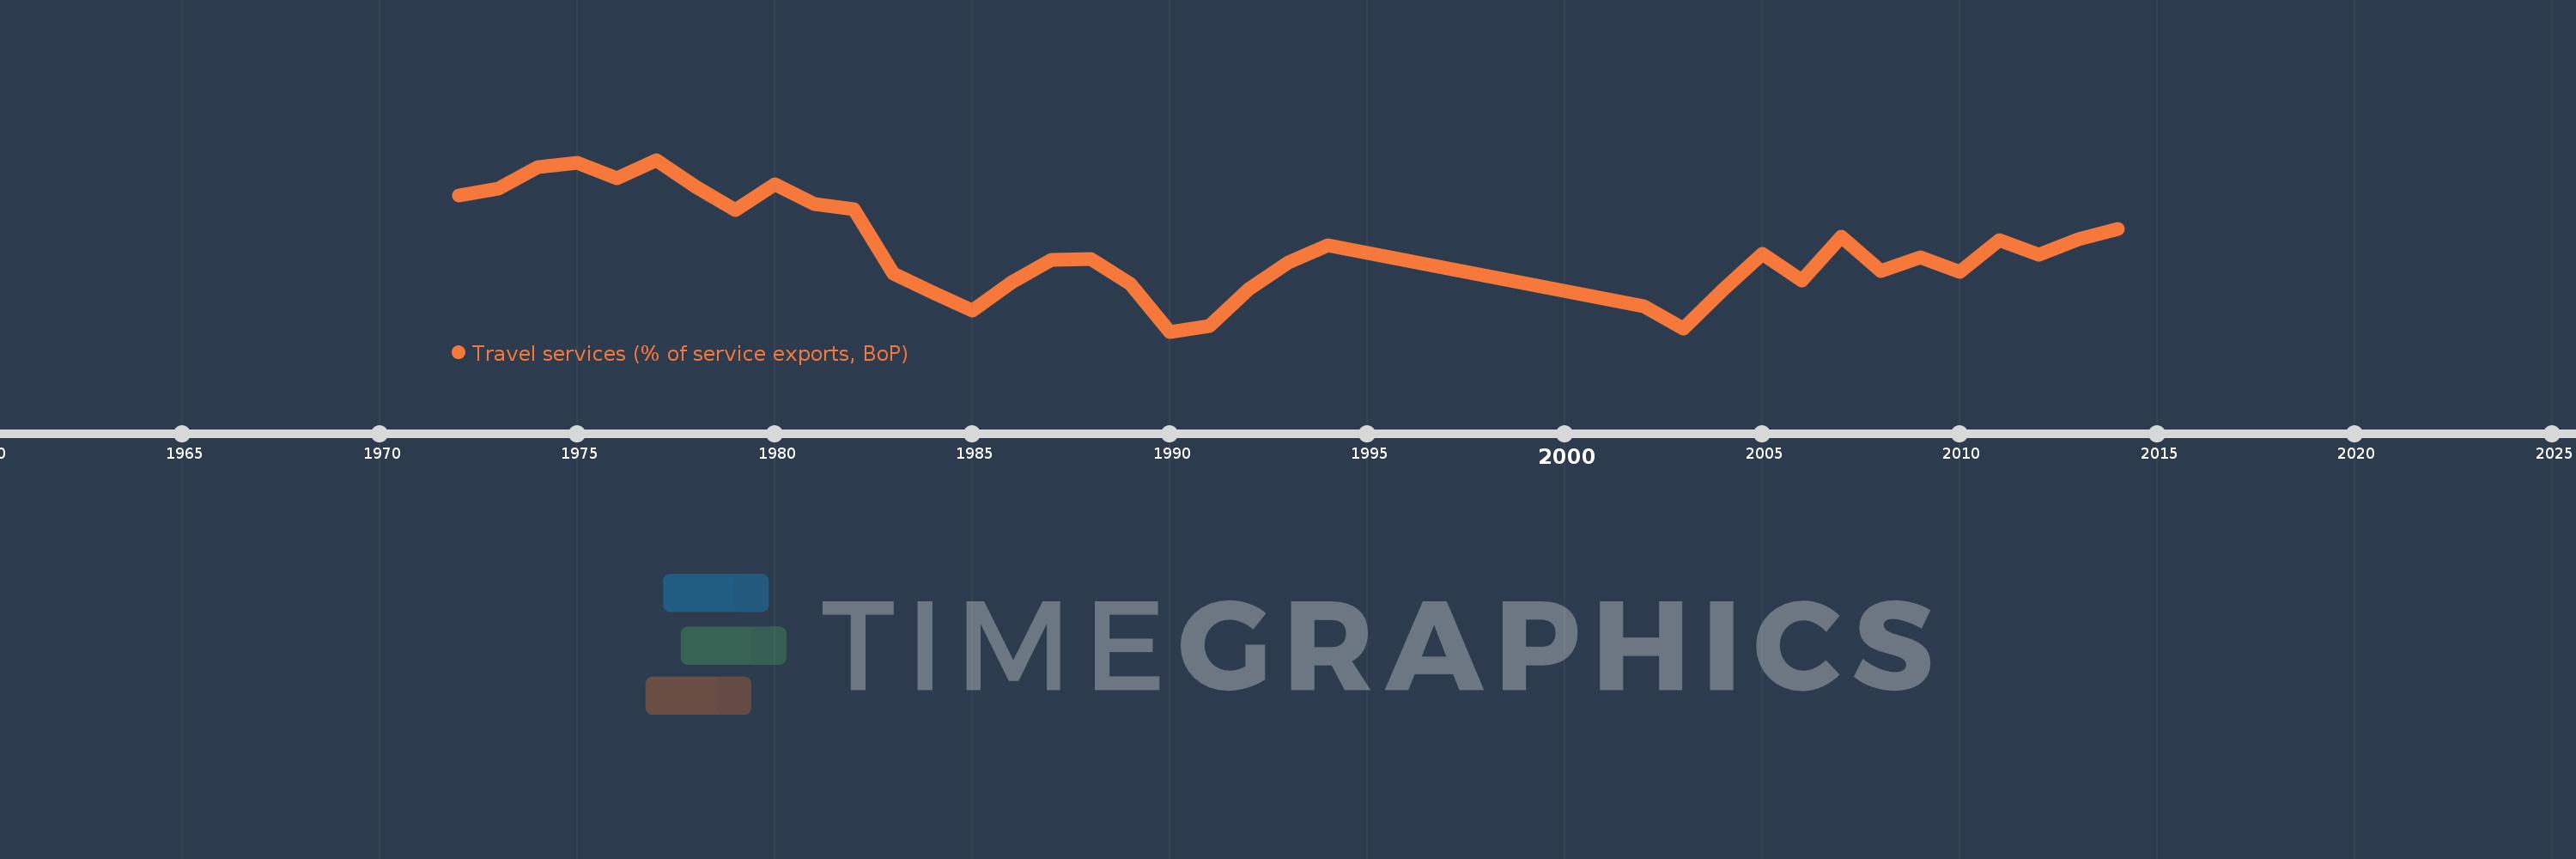
Travel services (% of service exports, BoP)
2014,2013,2012,2011,2010,2009,2008,2007,2006,2005,2004,2003,2002,1994,1993,1992,1991,1990,1989,1988,1987,1986,1985,1984,1983,1982,1981,1980,1979,1978,1977,1976,1975,1974,1973,1972
This statistics in other country:
AfghanistanAlbaniaAlgeriaAngolaAntigua and BarbudaArab WorldArgentinaArmeniaArubaAustraliaAustriaAzerbaijanBahamas, TheBahrainBangladeshBarbadosBelarusBelgiumBelizeBeninBermudaBhutanBoliviaBosnia and HerzegovinaBotswanaBrazilBrunei DarussalamBulgariaBurkina FasoBurundiCabo VerdeCambodiaCameroonCanadaCaribbean small statesCentral African RepublicCentral Europe and the BalticsChadChileChinaColombiaComorosCongo, Dem. Rep.Congo, Rep.Costa RicaCote d'IvoireCroatiaCuracaoCyprusCzech RepublicDenmarkDjiboutiDominicaDominican RepublicEarly-demographic dividendEast Asia & PacificEast Asia & Pacific (excluding high income)East Asia & Pacific (IDA & IBRD countries)EcuadorEgypt, Arab Rep.El SalvadorEritreaEstoniaEthiopiaEuro areaEurope & Central AsiaEurope & Central Asia (excluding high income)Europe & Central Asia (IDA & IBRD countries)European UnionFaroe IslandsFijiFinlandFragile and conflict affected situationsFranceFrench PolynesiaGabonGambia, TheGeorgiaGermanyGhanaGreeceGrenadaGuatemalaGuineaGuinea-BissauGuyanaHaitiHeavily indebted poor countries (HIPC)High incomeHondurasHong Kong SAR, ChinaHungaryIBRD onlyIcelandIDA & IBRD totalIDA onlyIDA totalIndiaIndonesiaIran, Islamic Rep.IraqIrelandIsraelItalyJamaicaJapanJordanKazakhstanKenyaKiribatiKorea, Rep.KosovoKuwaitKyrgyz RepublicLao PDRLate-demographic dividendLatin America & Caribbean Latin America & Caribbean (excluding high income)Latin America & the Caribbean (IDA & IBRD countries)LatviaLeast developed countries: UN classificationLebanonLesothoLiberiaLibyaLithuaniaLow & middle incomeLow incomeLower middle incomeLuxembourgMacao SAR, ChinaMacedonia, FYRMadagascarMalawiMalaysiaMaldivesMaliMaltaMarshall IslandsMauritaniaMauritiusMexicoMicronesia, Fed. Sts.Middle East & North Africa (excluding high income)Middle East & North Africa (IDA & IBRD countries)Middle incomeMoldovaMongoliaMontenegroMoroccoMozambiqueMyanmarNamibiaNepalNetherlandsNew CaledoniaNew ZealandNicaraguaNigerNigeriaNorth AmericaNorwayOECD membersOmanOther small statesPacific island small statesPakistanPalauPanamaPapua New GuineaParaguayPeruPhilippinesPolandPortugalPost-demographic dividendPre-demographic dividendQatarRomaniaRussian FederationRwandaSamoaSao Tome and PrincipeSaudi ArabiaSenegalSerbiaSeychellesSierra LeoneSingaporeSint Maarten (Dutch part)Slovak RepublicSloveniaSmall statesSolomon IslandsSouth AfricaSouth AsiaSouth Asia (IDA & IBRD)South SudanSpainSri LankaSt. Kitts and NevisSt. LuciaSt. Vincent and the GrenadinesSub-Saharan Africa Sub-Saharan Africa (excluding high income)Sub-Saharan Africa (IDA & IBRD countries)SudanSurinameSwazilandSwedenSwitzerlandSyrian Arab RepublicTajikistanTanzaniaThailandTimor-LesteTogoTongaTrinidad and TobagoTunisiaTurkeyTuvaluUgandaUkraineUnited KingdomUnited StatesUpper middle incomeUruguayVanuatuVenezuela, RBWest Bank and GazaWorldYemen, Rep.ZambiaZimbabwe Timeline:
This timeline shows a graph from 1972 to 2014 of Tonga. No data until 1971. Number of actual observations by date: 36.
Source name:
World Development Indicators
Source organization:
International Monetary Fund, Balance of Payments Statistics Yearbook and data files.
Categories, topics:
Economy & Growth, Trade
Last updated:
apr 23, 2017
Indicators value changes by year
Minimum:
25.068
jan 1, 1990
Maximum:
88.621
jan 1, 1977
At the date of observation
Value
Absolute change
Change from previous value
jan 1, 1972
75.583
+75.583
0.0%
jan 1, 1973
77.966
+2.383
3.15%
jan 1, 1974
85.797
+7.831
10.04%
jan 1, 1975
87.458
+1.662
1.94%
jan 1, 1976
81.663
-5.795
-6.63%
jan 1, 1977
88.621
+6.958
8.52%
jan 1, 1978
78.574
-10.046
-11.34%
jan 1, 1979
69.889
-8.686
-11.05%
jan 1, 1980
79.674
+9.785
14.0%
jan 1, 1981
72.245
-7.428
-9.32%
jan 1, 1982
70.193
-2.052
-2.84%
jan 1, 1983
46.625
-23.568
-33.58%
jan 1, 1984
39.585
-7.041
-15.1%
jan 1, 1985
32.711
-6.874
-17.36%
jan 1, 1986
43.204
+10.493
32.08%
jan 1, 1987
51.748
+8.544
19.78%
jan 1, 1988
51.763
+0.014
0.03%
jan 1, 1989
42.743
-9.02
-17.43%
jan 1, 1990
25.068
-17.675
-41.35%
jan 1, 1991
27.164
+2.095
8.36%
jan 1, 1992
40.77
+13.606
50.09%
jan 1, 1993
50.491
+9.721
23.84%
jan 1, 1994
57.069
+6.577
13.03%
jan 1, 2002
34.574
-22.495
-39.42%
jan 1, 2003
26.059
-8.515
-24.63%
jan 1, 2004
40.518
+14.459
55.48%
jan 1, 2005
53.921
+13.403
33.08%
jan 1, 2006
44.039
-9.882
-18.33%
jan 1, 2007
60.041
+16.002
36.34%
jan 1, 2008
47.596
-12.446
-20.73%
jan 1, 2009
52.507
+4.911
10.32%
jan 1, 2010
47.127
-5.38
-10.25%
jan 1, 2011
58.912
+11.785
25.01%
jan 1, 2012
53.652
-5.26
-8.93%
jan 1, 2013
59.078
+5.426
10.11%
jan 1, 2014
62.903
+3.824
6.47%
Ranking of countries by current statistics by years


Comments: