29
/
en
AIzaSyAYiBZKx7MnpbEhh9jyipgxe19OcubqV5w
April 1, 2024
280500
Vanuatu
VUT
true
2
1
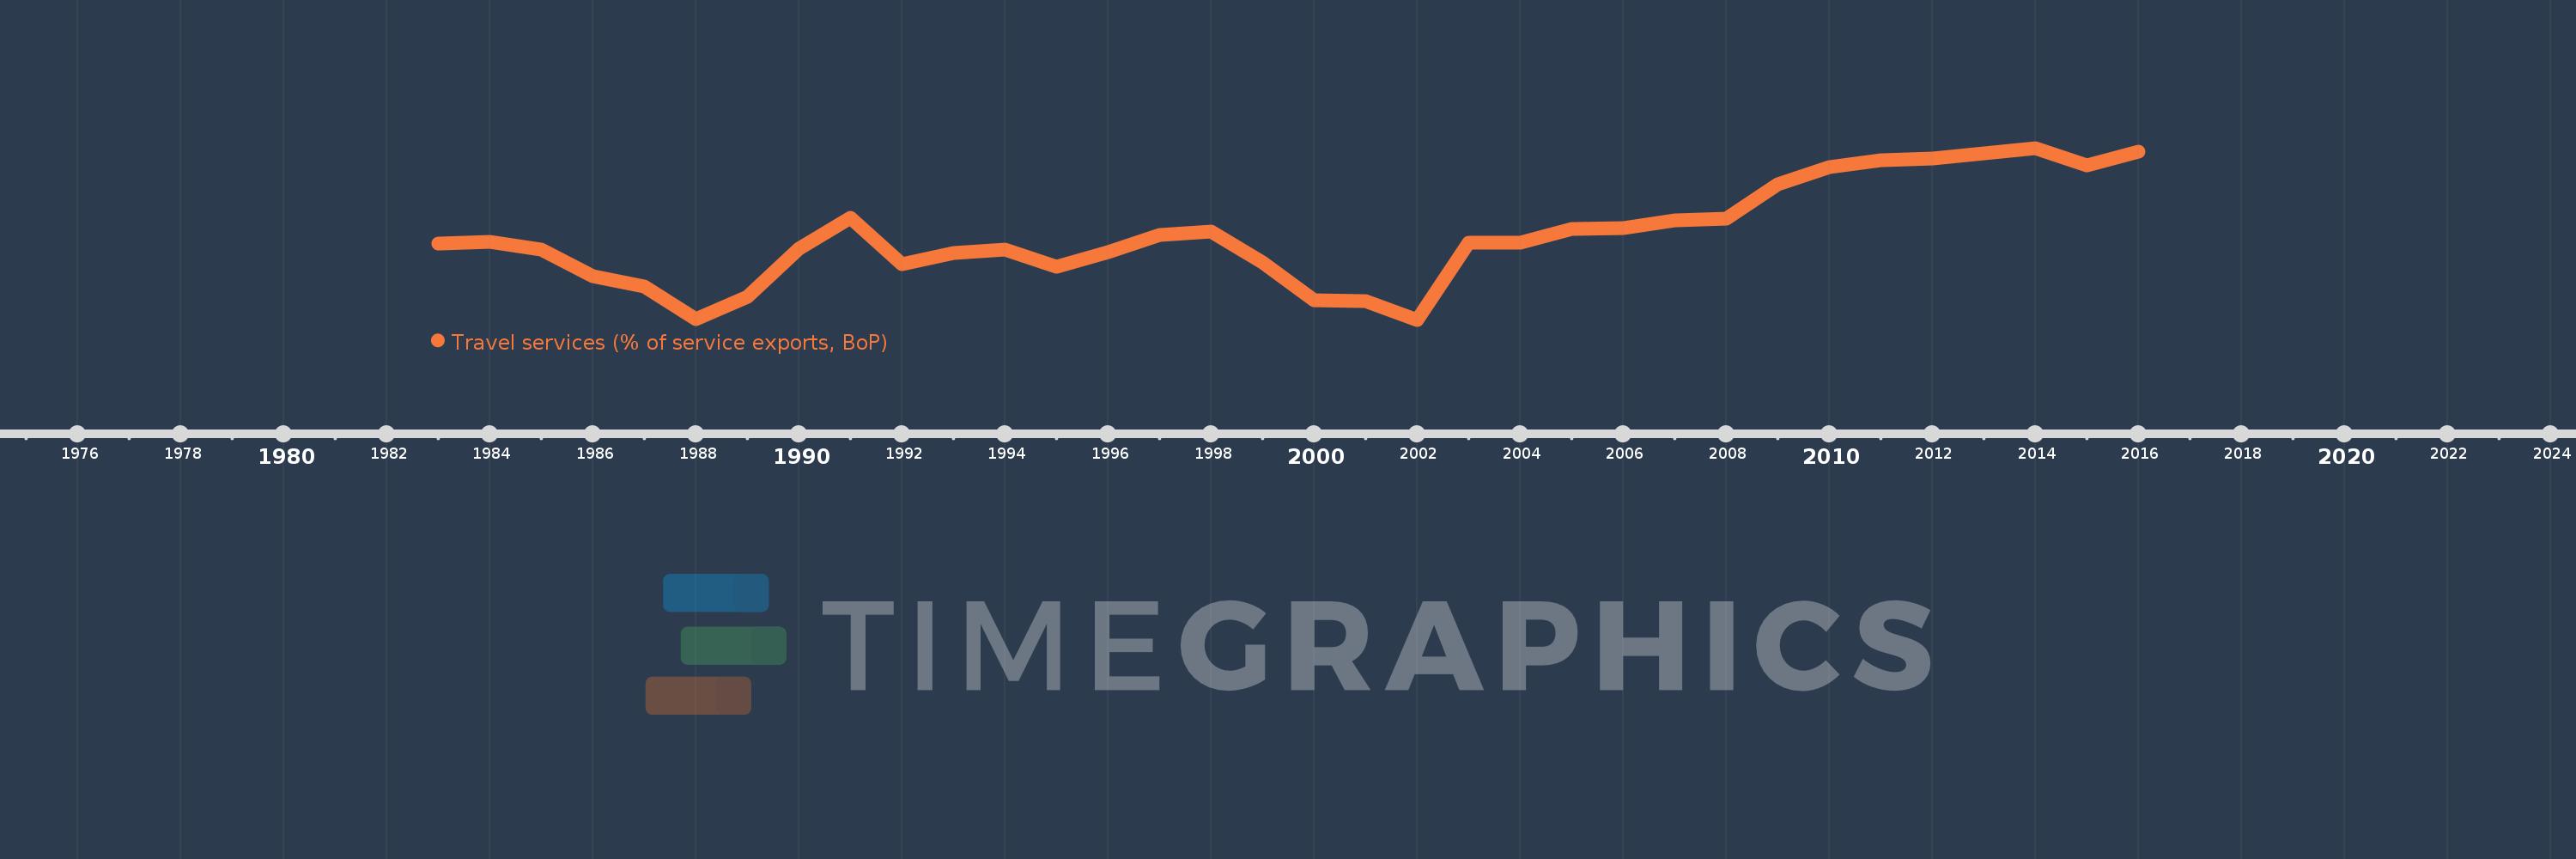
Travel services (% of service exports, BoP)
2016,2015,2014,2013,2012,2011,2010,2009,2008,2007,2006,2005,2004,2003,2002,2001,2000,1999,1998,1997,1996,1995,1994,1993,1992,1991,1990,1989,1988,1987,1986,1985,1984,1983
This statistics in other country:
AfghanistanAlbaniaAlgeriaAngolaAntigua and BarbudaArab WorldArgentinaArmeniaArubaAustraliaAustriaAzerbaijanBahamas, TheBahrainBangladeshBarbadosBelarusBelgiumBelizeBeninBermudaBhutanBoliviaBosnia and HerzegovinaBotswanaBrazilBrunei DarussalamBulgariaBurkina FasoBurundiCabo VerdeCambodiaCameroonCanadaCaribbean small statesCentral African RepublicCentral Europe and the BalticsChadChileChinaColombiaComorosCongo, Dem. Rep.Congo, Rep.Costa RicaCote d'IvoireCroatiaCuracaoCyprusCzech RepublicDenmarkDjiboutiDominicaDominican RepublicEarly-demographic dividendEast Asia & PacificEast Asia & Pacific (excluding high income)East Asia & Pacific (IDA & IBRD countries)EcuadorEgypt, Arab Rep.El SalvadorEritreaEstoniaEthiopiaEuro areaEurope & Central AsiaEurope & Central Asia (excluding high income)Europe & Central Asia (IDA & IBRD countries)European UnionFaroe IslandsFijiFinlandFragile and conflict affected situationsFranceFrench PolynesiaGabonGambia, TheGeorgiaGermanyGhanaGreeceGrenadaGuatemalaGuineaGuinea-BissauGuyanaHaitiHeavily indebted poor countries (HIPC)High incomeHondurasHong Kong SAR, ChinaHungaryIBRD onlyIcelandIDA & IBRD totalIDA onlyIDA totalIndiaIndonesiaIran, Islamic Rep.IraqIrelandIsraelItalyJamaicaJapanJordanKazakhstanKenyaKiribatiKorea, Rep.KosovoKuwaitKyrgyz RepublicLao PDRLate-demographic dividendLatin America & Caribbean Latin America & Caribbean (excluding high income)Latin America & the Caribbean (IDA & IBRD countries)LatviaLeast developed countries: UN classificationLebanonLesothoLiberiaLibyaLithuaniaLow & middle incomeLow incomeLower middle incomeLuxembourgMacao SAR, ChinaMacedonia, FYRMadagascarMalawiMalaysiaMaldivesMaliMaltaMarshall IslandsMauritaniaMauritiusMexicoMicronesia, Fed. Sts.Middle East & North Africa (excluding high income)Middle East & North Africa (IDA & IBRD countries)Middle incomeMoldovaMongoliaMontenegroMoroccoMozambiqueMyanmarNamibiaNepalNetherlandsNew CaledoniaNew ZealandNicaraguaNigerNigeriaNorth AmericaNorwayOECD membersOmanOther small statesPacific island small statesPakistanPalauPanamaPapua New GuineaParaguayPeruPhilippinesPolandPortugalPost-demographic dividendPre-demographic dividendQatarRomaniaRussian FederationRwandaSamoaSao Tome and PrincipeSaudi ArabiaSenegalSerbiaSeychellesSierra LeoneSingaporeSint Maarten (Dutch part)Slovak RepublicSloveniaSmall statesSolomon IslandsSouth AfricaSouth AsiaSouth Asia (IDA & IBRD)South SudanSpainSri LankaSt. Kitts and NevisSt. LuciaSt. Vincent and the GrenadinesSub-Saharan Africa Sub-Saharan Africa (excluding high income)Sub-Saharan Africa (IDA & IBRD countries)SudanSurinameSwazilandSwedenSwitzerlandSyrian Arab RepublicTajikistanTanzaniaThailandTimor-LesteTogoTongaTrinidad and TobagoTunisiaTurkeyTuvaluUgandaUkraineUnited KingdomUnited StatesUpper middle incomeUruguayVanuatuVenezuela, RBWest Bank and GazaWorldYemen, Rep.ZambiaZimbabwe Timeline:
This timeline shows a graph from 1983 to 2016 of Vanuatu. No data until 1982. Number of actual observations by date: 34.
Source name:
World Development Indicators
Source organization:
International Monetary Fund, Balance of Payments Statistics Yearbook and data files.
Categories, topics:
Economy & Growth, Trade
Last updated:
apr 23, 2017
Indicators value changes by year
Minimum:
38.669
jan 1, 2002
Maximum:
81.431
jan 1, 2014
At the date of observation
Value
Absolute change
Change from previous value
jan 1, 1983
57.6
+57.6
0.0%
jan 1, 1984
58.093
+0.493
0.86%
jan 1, 1985
56.154
-1.94
-3.34%
jan 1, 1986
49.559
-6.595
-11.74%
jan 1, 1987
46.856
-2.703
-5.46%
jan 1, 1988
38.893
-7.963
-17.0%
jan 1, 1989
44.345
+5.452
14.02%
jan 1, 1990
56.383
+12.038
27.15%
jan 1, 1991
64.083
+7.7
13.66%
jan 1, 1992
52.592
-11.491
-17.93%
jan 1, 1993
55.237
+2.646
5.03%
jan 1, 1994
56.112
+0.875
1.58%
jan 1, 1995
51.844
-4.267
-7.61%
jan 1, 1996
55.592
+3.748
7.23%
jan 1, 1997
59.852
+4.26
7.66%
jan 1, 1998
60.593
+0.741
1.24%
jan 1, 1999
52.964
-7.628
-12.59%
jan 1, 2000
43.571
-9.393
-17.74%
jan 1, 2001
43.227
-0.344
-0.79%
jan 1, 2002
38.669
-4.558
-10.54%
jan 1, 2003
57.857
+19.187
49.62%
jan 1, 2004
57.753
-0.104
-0.18%
jan 1, 2005
61.306
+3.553
6.15%
jan 1, 2006
61.554
+0.248
0.4%
jan 1, 2007
63.39
+1.837
2.98%
jan 1, 2008
63.835
+0.445
0.7%
jan 1, 2009
72.412
+8.577
13.44%
jan 1, 2010
76.691
+4.279
5.91%
jan 1, 2011
78.457
+1.766
2.3%
jan 1, 2012
78.791
+0.334
0.43%
jan 1, 2013
79.98
+1.189
1.51%
jan 1, 2014
81.431
+1.451
1.81%
jan 1, 2015
77.101
-4.33
-5.32%
jan 1, 2016
80.459
+3.358
4.36%
Ranking of countries by current statistics by years


Comments: