29
/
en
AIzaSyAYiBZKx7MnpbEhh9jyipgxe19OcubqV5w
April 1, 2024
47823
Lower middle income
LMC
false
2
1
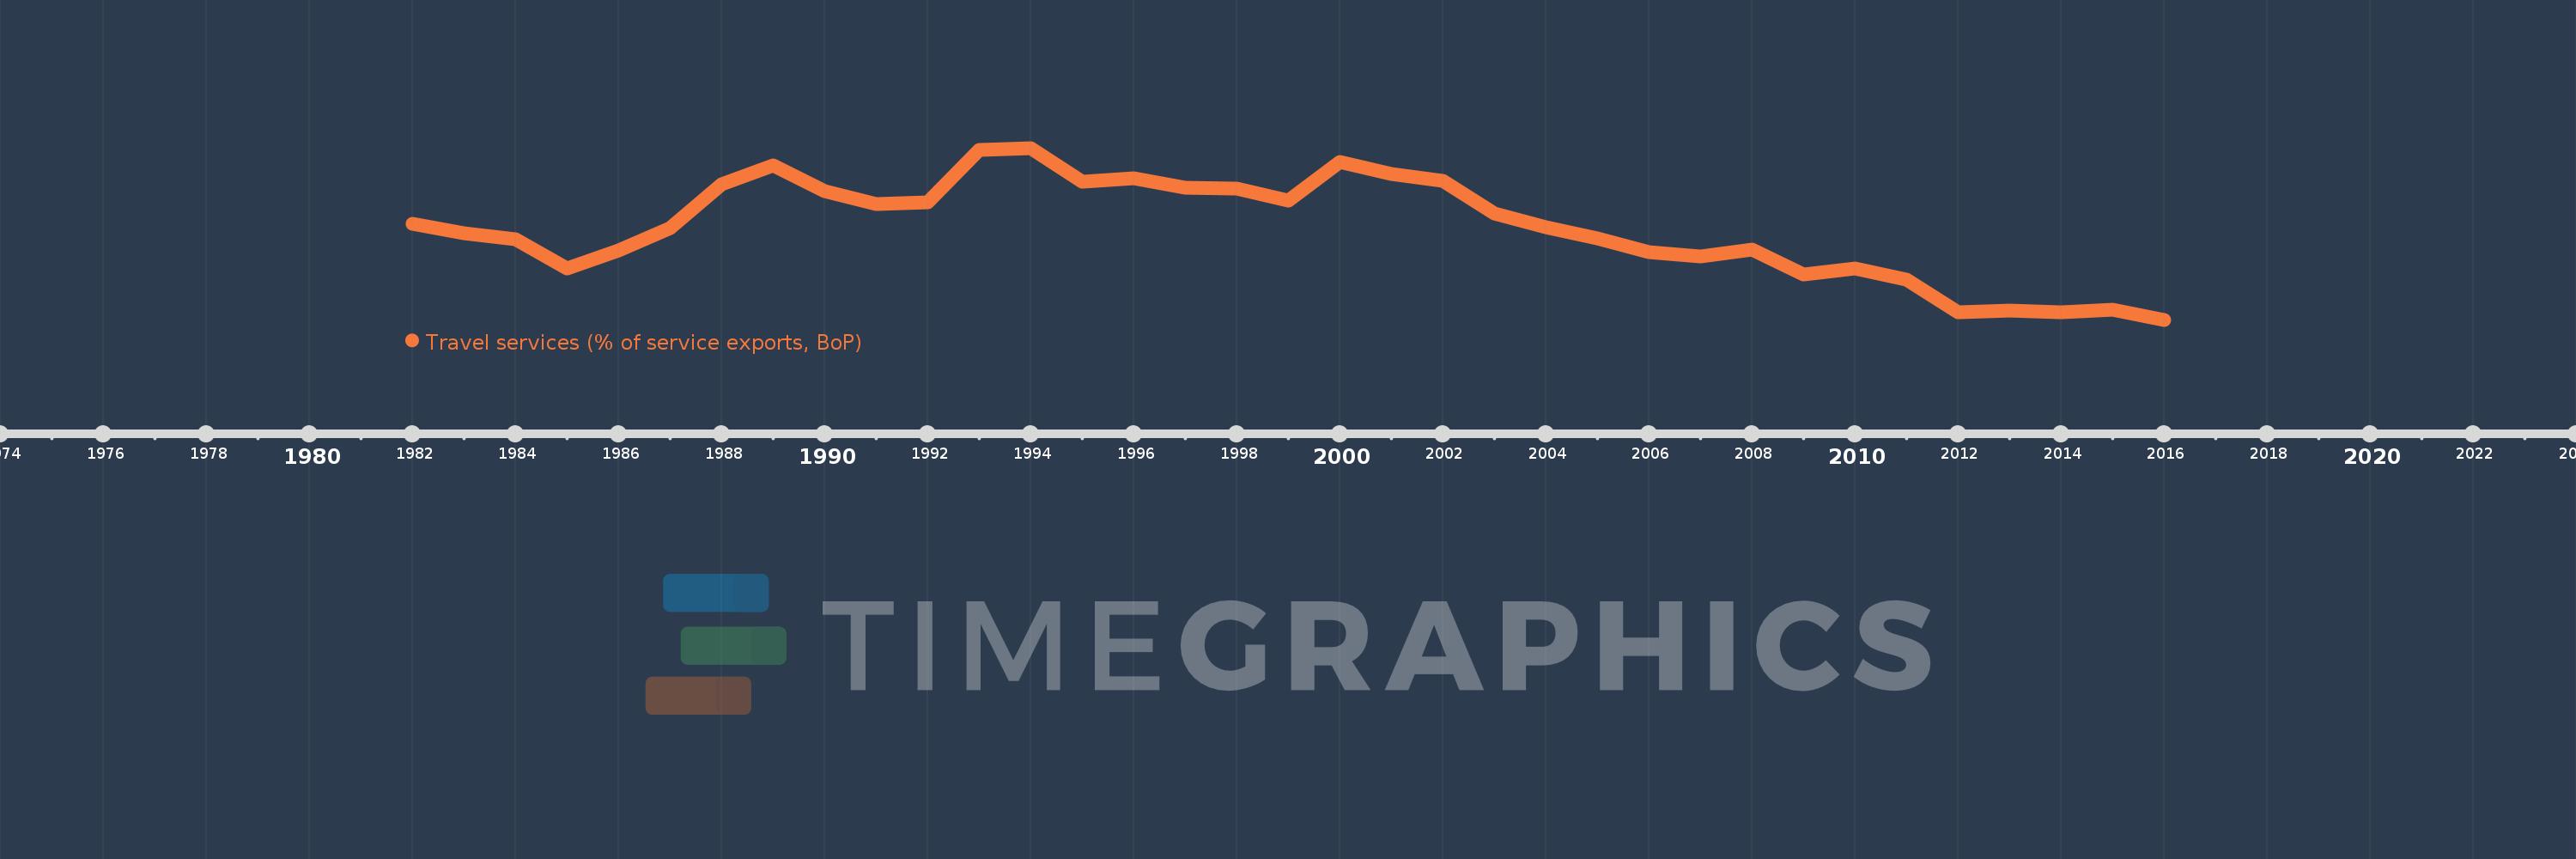
Travel services (% of service exports, BoP)
2016,2015,2014,2013,2012,2011,2010,2009,2008,2007,2006,2005,2004,2003,2002,2001,2000,1999,1998,1997,1996,1995,1994,1993,1992,1991,1990,1989,1988,1987,1986,1985,1984,1983,1982
This statistics in other country:
AfghanistanAlbaniaAlgeriaAngolaAntigua and BarbudaArab WorldArgentinaArmeniaArubaAustraliaAustriaAzerbaijanBahamas, TheBahrainBangladeshBarbadosBelarusBelgiumBelizeBeninBermudaBhutanBoliviaBosnia and HerzegovinaBotswanaBrazilBrunei DarussalamBulgariaBurkina FasoBurundiCabo VerdeCambodiaCameroonCanadaCaribbean small statesCentral African RepublicCentral Europe and the BalticsChadChileChinaColombiaComorosCongo, Dem. Rep.Congo, Rep.Costa RicaCote d'IvoireCroatiaCuracaoCyprusCzech RepublicDenmarkDjiboutiDominicaDominican RepublicEarly-demographic dividendEast Asia & PacificEast Asia & Pacific (excluding high income)East Asia & Pacific (IDA & IBRD countries)EcuadorEgypt, Arab Rep.El SalvadorEritreaEstoniaEthiopiaEuro areaEurope & Central AsiaEurope & Central Asia (excluding high income)Europe & Central Asia (IDA & IBRD countries)European UnionFaroe IslandsFijiFinlandFragile and conflict affected situationsFranceFrench PolynesiaGabonGambia, TheGeorgiaGermanyGhanaGreeceGrenadaGuatemalaGuineaGuinea-BissauGuyanaHaitiHeavily indebted poor countries (HIPC)High incomeHondurasHong Kong SAR, ChinaHungaryIBRD onlyIcelandIDA & IBRD totalIDA onlyIDA totalIndiaIndonesiaIran, Islamic Rep.IraqIrelandIsraelItalyJamaicaJapanJordanKazakhstanKenyaKiribatiKorea, Rep.KosovoKuwaitKyrgyz RepublicLao PDRLate-demographic dividendLatin America & Caribbean Latin America & Caribbean (excluding high income)Latin America & the Caribbean (IDA & IBRD countries)LatviaLeast developed countries: UN classificationLebanonLesothoLiberiaLibyaLithuaniaLow & middle incomeLow incomeLower middle incomeLuxembourgMacao SAR, ChinaMacedonia, FYRMadagascarMalawiMalaysiaMaldivesMaliMaltaMarshall IslandsMauritaniaMauritiusMexicoMicronesia, Fed. Sts.Middle East & North Africa (excluding high income)Middle East & North Africa (IDA & IBRD countries)Middle incomeMoldovaMongoliaMontenegroMoroccoMozambiqueMyanmarNamibiaNepalNetherlandsNew CaledoniaNew ZealandNicaraguaNigerNigeriaNorth AmericaNorwayOECD membersOmanOther small statesPacific island small statesPakistanPalauPanamaPapua New GuineaParaguayPeruPhilippinesPolandPortugalPost-demographic dividendPre-demographic dividendQatarRomaniaRussian FederationRwandaSamoaSao Tome and PrincipeSaudi ArabiaSenegalSerbiaSeychellesSierra LeoneSingaporeSint Maarten (Dutch part)Slovak RepublicSloveniaSmall statesSolomon IslandsSouth AfricaSouth AsiaSouth Asia (IDA & IBRD)South SudanSpainSri LankaSt. Kitts and NevisSt. LuciaSt. Vincent and the GrenadinesSub-Saharan Africa Sub-Saharan Africa (excluding high income)Sub-Saharan Africa (IDA & IBRD countries)SudanSurinameSwazilandSwedenSwitzerlandSyrian Arab RepublicTajikistanTanzaniaThailandTimor-LesteTogoTongaTrinidad and TobagoTunisiaTurkeyTuvaluUgandaUkraineUnited KingdomUnited StatesUpper middle incomeUruguayVanuatuVenezuela, RBWest Bank and GazaWorldYemen, Rep.ZambiaZimbabwe Timeline:
This timeline shows a graph from 1982 to 2016 of Lower middle income. No data until 1981. Number of actual observations by date: 35.
Source name:
World Development Indicators
Source organization:
International Monetary Fund, Balance of Payments Statistics Yearbook and data files.
Categories, topics:
Economy & Growth, Trade
Last updated:
apr 23, 2017
Indicators value changes by year
Minimum:
22.436
jan 1, 2016
Maximum:
38.438
jan 1, 1994
At the date of observation
Value
Absolute change
Change from previous value
jan 1, 1982
31.344
+31.344
0.0%
jan 1, 1983
30.479
-0.864
-2.76%
jan 1, 1984
29.957
-0.523
-1.72%
jan 1, 1985
27.203
-2.754
-9.19%
jan 1, 1986
28.862
+1.659
6.1%
jan 1, 1987
30.949
+2.087
7.23%
jan 1, 1988
35.032
+4.084
13.2%
jan 1, 1989
36.813
+1.78
5.08%
jan 1, 1990
34.384
-2.428
-6.6%
jan 1, 1991
33.222
-1.162
-3.38%
jan 1, 1992
33.365
+0.143
0.43%
jan 1, 1993
38.254
+4.889
14.65%
jan 1, 1994
38.438
+0.184
0.48%
jan 1, 1995
35.31
-3.128
-8.14%
jan 1, 1996
35.602
+0.291
0.83%
jan 1, 1997
34.701
-0.9
-2.53%
jan 1, 1998
34.677
-0.024
-0.07%
jan 1, 1999
33.514
-1.163
-3.35%
jan 1, 2000
37.15
+3.636
10.85%
jan 1, 2001
35.993
-1.157
-3.11%
jan 1, 2002
35.338
-0.656
-1.82%
jan 1, 2003
32.371
-2.966
-8.39%
jan 1, 2004
31.016
-1.355
-4.19%
jan 1, 2005
29.981
-1.035
-3.34%
jan 1, 2006
28.762
-1.219
-4.07%
jan 1, 2007
28.303
-0.459
-1.59%
jan 1, 2008
28.937
+0.634
2.24%
jan 1, 2009
26.66
-2.277
-7.87%
jan 1, 2010
27.219
+0.559
2.1%
jan 1, 2011
26.156
-1.063
-3.91%
jan 1, 2012
23.143
-3.013
-11.52%
jan 1, 2013
23.308
+0.165
0.71%
jan 1, 2014
23.128
-0.179
-0.77%
jan 1, 2015
23.358
+0.23
0.99%
jan 1, 2016
22.436
-0.922
-3.95%
Ranking of countries by current statistics by years


Comments: