29
/
en
AIzaSyAYiBZKx7MnpbEhh9jyipgxe19OcubqV5w
April 1, 2024
226507
Portugal
PRT
true
2
1
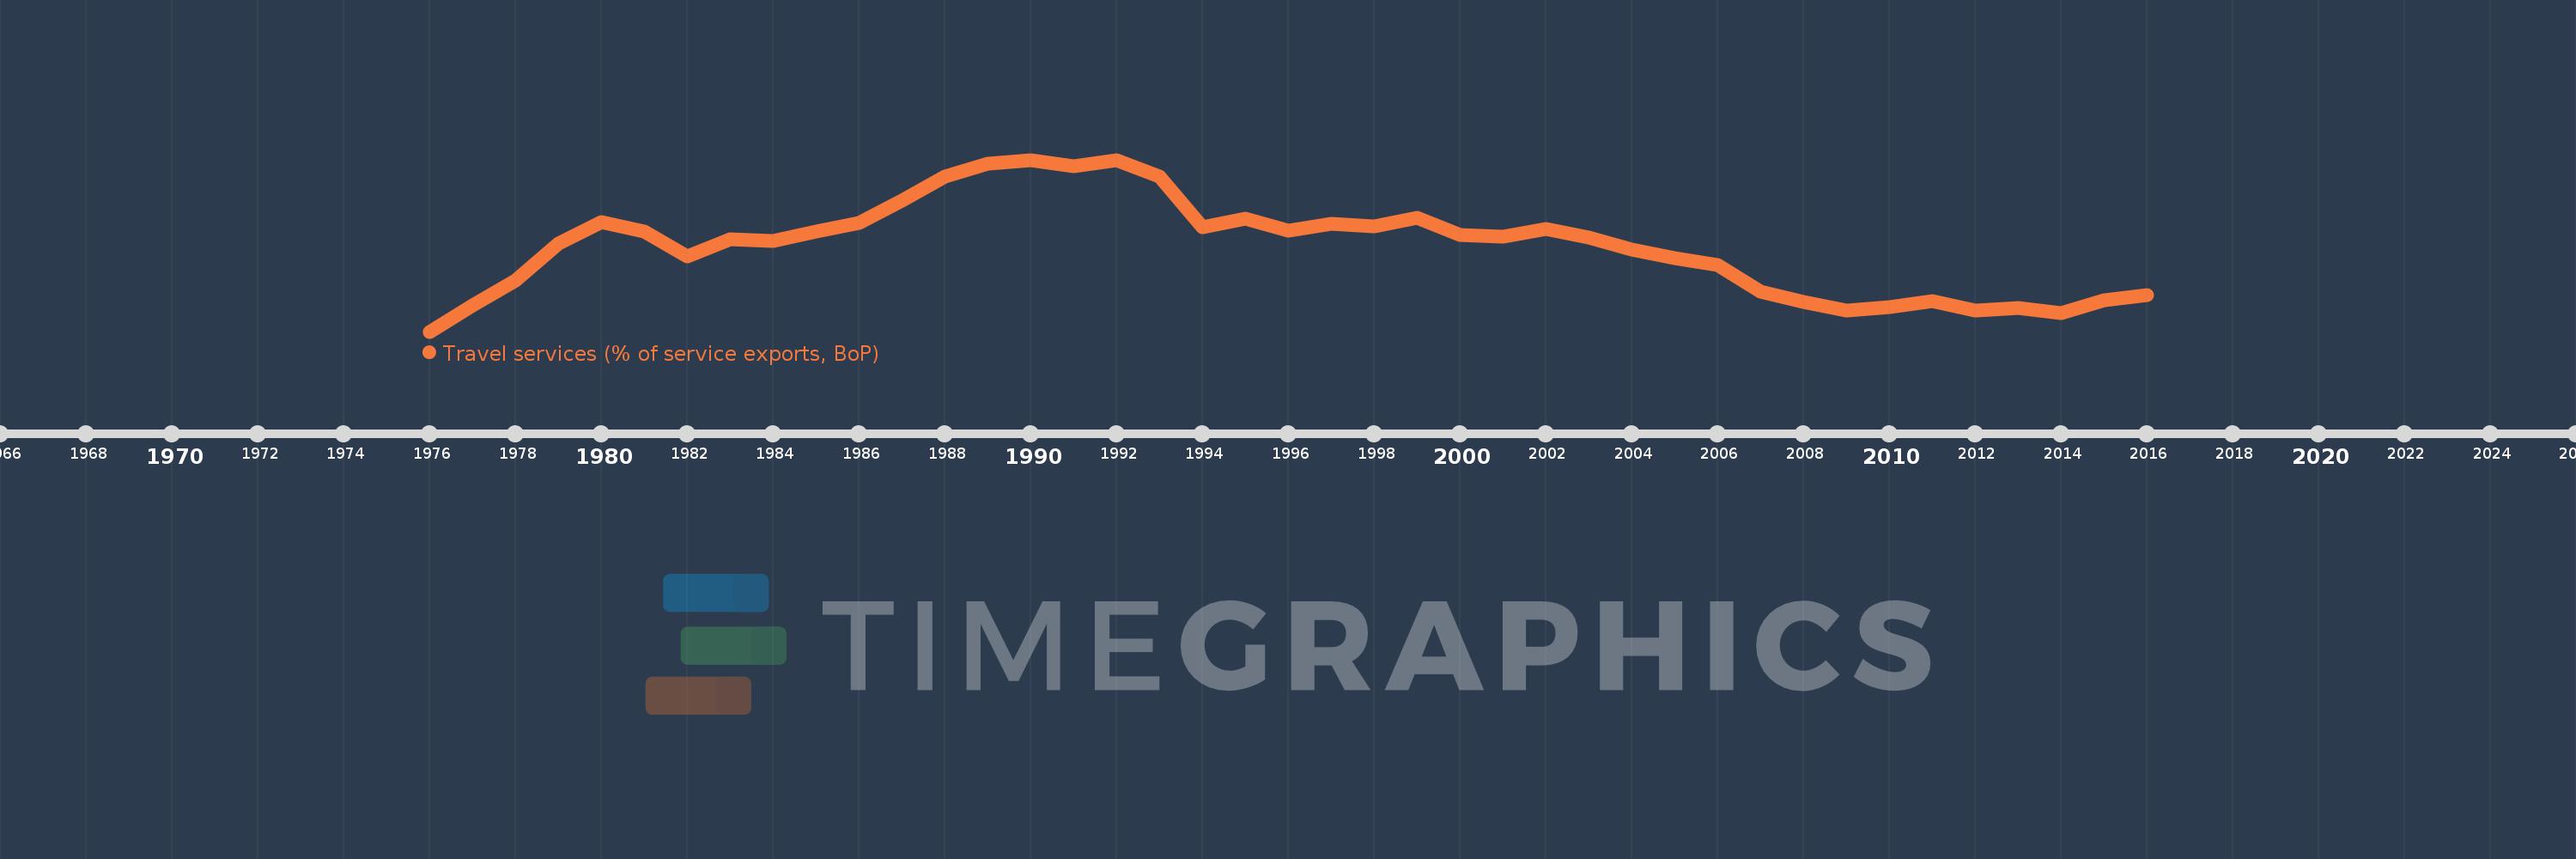
Travel services (% of service exports, BoP)
2016,2015,2014,2013,2012,2011,2010,2009,2008,2007,2006,2005,2004,2003,2002,2001,2000,1999,1998,1997,1996,1995,1994,1993,1992,1991,1990,1989,1988,1987,1986,1985,1984,1983,1982,1981,1980,1979,1978,1977,1976
This statistics in other country:
AfghanistanAlbaniaAlgeriaAngolaAntigua and BarbudaArab WorldArgentinaArmeniaArubaAustraliaAustriaAzerbaijanBahamas, TheBahrainBangladeshBarbadosBelarusBelgiumBelizeBeninBermudaBhutanBoliviaBosnia and HerzegovinaBotswanaBrazilBrunei DarussalamBulgariaBurkina FasoBurundiCabo VerdeCambodiaCameroonCanadaCaribbean small statesCentral African RepublicCentral Europe and the BalticsChadChileChinaColombiaComorosCongo, Dem. Rep.Congo, Rep.Costa RicaCote d'IvoireCroatiaCuracaoCyprusCzech RepublicDenmarkDjiboutiDominicaDominican RepublicEarly-demographic dividendEast Asia & PacificEast Asia & Pacific (excluding high income)East Asia & Pacific (IDA & IBRD countries)EcuadorEgypt, Arab Rep.El SalvadorEritreaEstoniaEthiopiaEuro areaEurope & Central AsiaEurope & Central Asia (excluding high income)Europe & Central Asia (IDA & IBRD countries)European UnionFaroe IslandsFijiFinlandFragile and conflict affected situationsFranceFrench PolynesiaGabonGambia, TheGeorgiaGermanyGhanaGreeceGrenadaGuatemalaGuineaGuinea-BissauGuyanaHaitiHeavily indebted poor countries (HIPC)High incomeHondurasHong Kong SAR, ChinaHungaryIBRD onlyIcelandIDA & IBRD totalIDA onlyIDA totalIndiaIndonesiaIran, Islamic Rep.IraqIrelandIsraelItalyJamaicaJapanJordanKazakhstanKenyaKiribatiKorea, Rep.KosovoKuwaitKyrgyz RepublicLao PDRLate-demographic dividendLatin America & Caribbean Latin America & Caribbean (excluding high income)Latin America & the Caribbean (IDA & IBRD countries)LatviaLeast developed countries: UN classificationLebanonLesothoLiberiaLibyaLithuaniaLow & middle incomeLow incomeLower middle incomeLuxembourgMacao SAR, ChinaMacedonia, FYRMadagascarMalawiMalaysiaMaldivesMaliMaltaMarshall IslandsMauritaniaMauritiusMexicoMicronesia, Fed. Sts.Middle East & North Africa (excluding high income)Middle East & North Africa (IDA & IBRD countries)Middle incomeMoldovaMongoliaMontenegroMoroccoMozambiqueMyanmarNamibiaNepalNetherlandsNew CaledoniaNew ZealandNicaraguaNigerNigeriaNorth AmericaNorwayOECD membersOmanOther small statesPacific island small statesPakistanPalauPanamaPapua New GuineaParaguayPeruPhilippinesPolandPortugalPost-demographic dividendPre-demographic dividendQatarRomaniaRussian FederationRwandaSamoaSao Tome and PrincipeSaudi ArabiaSenegalSerbiaSeychellesSierra LeoneSingaporeSint Maarten (Dutch part)Slovak RepublicSloveniaSmall statesSolomon IslandsSouth AfricaSouth AsiaSouth Asia (IDA & IBRD)South SudanSpainSri LankaSt. Kitts and NevisSt. LuciaSt. Vincent and the GrenadinesSub-Saharan Africa Sub-Saharan Africa (excluding high income)Sub-Saharan Africa (IDA & IBRD countries)SudanSurinameSwazilandSwedenSwitzerlandSyrian Arab RepublicTajikistanTanzaniaThailandTimor-LesteTogoTongaTrinidad and TobagoTunisiaTurkeyTuvaluUgandaUkraineUnited KingdomUnited StatesUpper middle incomeUruguayVanuatuVenezuela, RBWest Bank and GazaWorldYemen, Rep.ZambiaZimbabwe Timeline:
This timeline shows a graph from 1976 to 2016 of Portugal. No data until 1975. Number of actual observations by date: 41.
Source name:
World Development Indicators
Source organization:
International Monetary Fund, Balance of Payments Statistics Yearbook and data files.
Categories, topics:
Economy & Growth, Trade
Last updated:
apr 23, 2017
Indicators value changes by year
Minimum:
38.218
jan 1, 1976
Maximum:
70.962
jan 1, 1992
At the date of observation
Value
Absolute change
Change from previous value
jan 1, 1976
38.218
+38.218
0.0%
jan 1, 1977
43.151
+4.932
12.91%
jan 1, 1978
47.974
+4.823
11.18%
jan 1, 1979
54.928
+6.954
14.5%
jan 1, 1980
59.167
+4.239
7.72%
jan 1, 1981
57.257
-1.909
-3.23%
jan 1, 1982
52.577
-4.68
-8.17%
jan 1, 1983
55.826
+3.249
6.18%
jan 1, 1984
55.425
-0.401
-0.72%
jan 1, 1985
57.262
+1.836
3.31%
jan 1, 1986
58.871
+1.609
2.81%
jan 1, 1987
63.223
+4.353
7.39%
jan 1, 1988
67.758
+4.535
7.17%
jan 1, 1989
70.29
+2.532
3.74%
jan 1, 1990
70.834
+0.544
0.77%
jan 1, 1991
69.783
-1.051
-1.48%
jan 1, 1992
70.962
+1.179
1.69%
jan 1, 1993
67.693
-3.27
-4.61%
jan 1, 1994
58.077
-9.616
-14.21%
jan 1, 1995
59.676
+1.599
2.75%
jan 1, 1996
57.382
-2.293
-3.84%
jan 1, 1997
58.813
+1.431
2.49%
jan 1, 1998
58.261
-0.553
-0.94%
jan 1, 1999
59.891
+1.63
2.8%
jan 1, 2000
56.584
-3.307
-5.52%
jan 1, 2001
56.241
-0.343
-0.61%
jan 1, 2002
57.815
+1.574
2.8%
jan 1, 2003
56.109
-1.707
-2.95%
jan 1, 2004
53.826
-2.283
-4.07%
jan 1, 2005
52.162
-1.664
-3.09%
jan 1, 2006
50.83
-1.332
-2.55%
jan 1, 2007
45.811
-5.02
-9.88%
jan 1, 2008
43.829
-1.981
-4.32%
jan 1, 2009
42.19
-1.639
-3.74%
jan 1, 2010
42.9
+0.71
1.68%
jan 1, 2011
43.974
+1.074
2.5%
jan 1, 2012
42.299
-1.675
-3.81%
jan 1, 2013
42.78
+0.48
1.14%
jan 1, 2014
41.817
-0.963
-2.25%
jan 1, 2015
44.149
+2.333
5.58%
jan 1, 2016
45.165
+1.016
2.3%
Ranking of countries by current statistics by years


Comments: