29
/
en
AIzaSyAYiBZKx7MnpbEhh9jyipgxe19OcubqV5w
April 1, 2024
195047
Mauritius
MUS
true
2
1
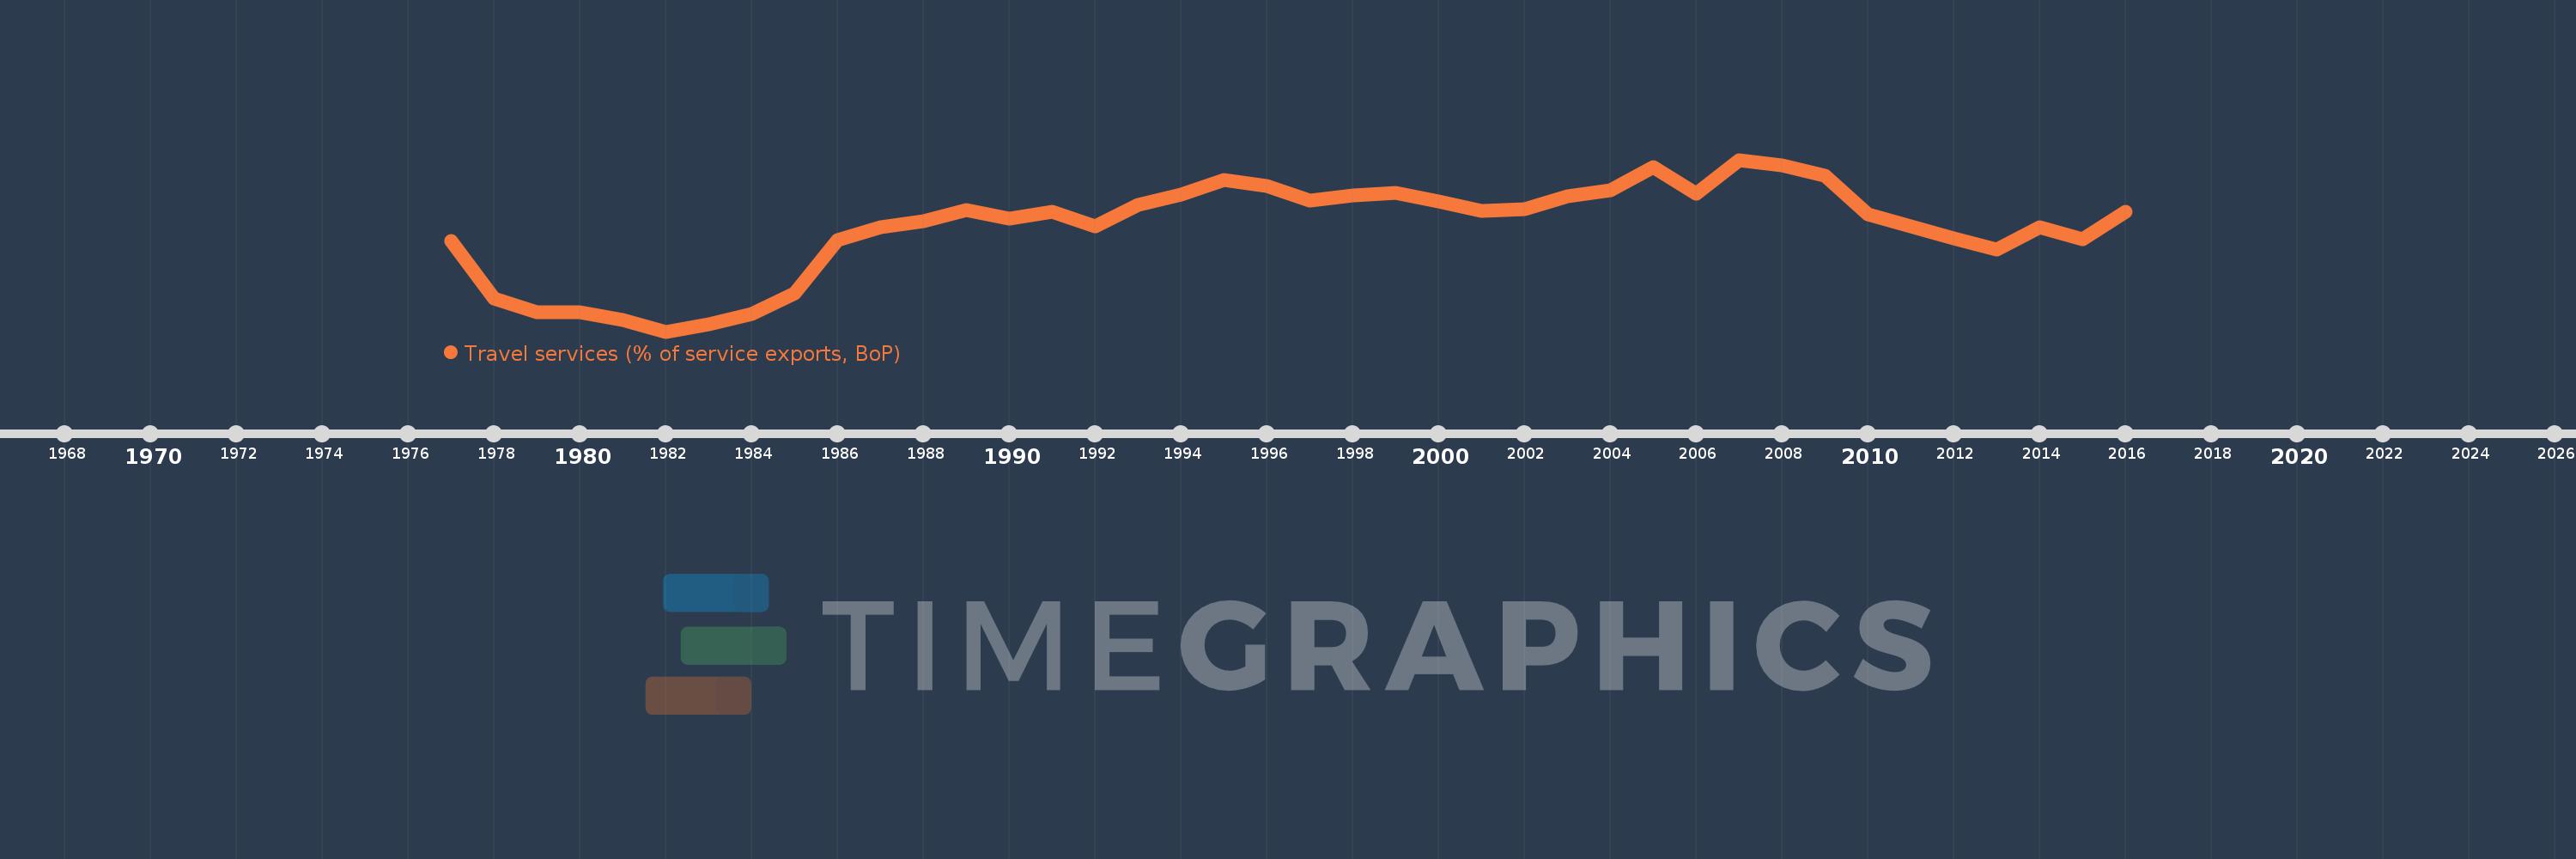
Travel services (% of service exports, BoP)
2016,2015,2014,2013,2012,2011,2010,2009,2008,2007,2006,2005,2004,2003,2002,2001,2000,1999,1998,1997,1996,1995,1994,1993,1992,1991,1990,1989,1988,1987,1986,1985,1984,1983,1982,1981,1980,1979,1978,1977
This statistics in other country:
AfghanistanAlbaniaAlgeriaAngolaAntigua and BarbudaArab WorldArgentinaArmeniaArubaAustraliaAustriaAzerbaijanBahamas, TheBahrainBangladeshBarbadosBelarusBelgiumBelizeBeninBermudaBhutanBoliviaBosnia and HerzegovinaBotswanaBrazilBrunei DarussalamBulgariaBurkina FasoBurundiCabo VerdeCambodiaCameroonCanadaCaribbean small statesCentral African RepublicCentral Europe and the BalticsChadChileChinaColombiaComorosCongo, Dem. Rep.Congo, Rep.Costa RicaCote d'IvoireCroatiaCuracaoCyprusCzech RepublicDenmarkDjiboutiDominicaDominican RepublicEarly-demographic dividendEast Asia & PacificEast Asia & Pacific (excluding high income)East Asia & Pacific (IDA & IBRD countries)EcuadorEgypt, Arab Rep.El SalvadorEritreaEstoniaEthiopiaEuro areaEurope & Central AsiaEurope & Central Asia (excluding high income)Europe & Central Asia (IDA & IBRD countries)European UnionFaroe IslandsFijiFinlandFragile and conflict affected situationsFranceFrench PolynesiaGabonGambia, TheGeorgiaGermanyGhanaGreeceGrenadaGuatemalaGuineaGuinea-BissauGuyanaHaitiHeavily indebted poor countries (HIPC)High incomeHondurasHong Kong SAR, ChinaHungaryIBRD onlyIcelandIDA & IBRD totalIDA onlyIDA totalIndiaIndonesiaIran, Islamic Rep.IraqIrelandIsraelItalyJamaicaJapanJordanKazakhstanKenyaKiribatiKorea, Rep.KosovoKuwaitKyrgyz RepublicLao PDRLate-demographic dividendLatin America & Caribbean Latin America & Caribbean (excluding high income)Latin America & the Caribbean (IDA & IBRD countries)LatviaLeast developed countries: UN classificationLebanonLesothoLiberiaLibyaLithuaniaLow & middle incomeLow incomeLower middle incomeLuxembourgMacao SAR, ChinaMacedonia, FYRMadagascarMalawiMalaysiaMaldivesMaliMaltaMarshall IslandsMauritaniaMauritiusMexicoMicronesia, Fed. Sts.Middle East & North Africa (excluding high income)Middle East & North Africa (IDA & IBRD countries)Middle incomeMoldovaMongoliaMontenegroMoroccoMozambiqueMyanmarNamibiaNepalNetherlandsNew CaledoniaNew ZealandNicaraguaNigerNigeriaNorth AmericaNorwayOECD membersOmanOther small statesPacific island small statesPakistanPalauPanamaPapua New GuineaParaguayPeruPhilippinesPolandPortugalPost-demographic dividendPre-demographic dividendQatarRomaniaRussian FederationRwandaSamoaSao Tome and PrincipeSaudi ArabiaSenegalSerbiaSeychellesSierra LeoneSingaporeSint Maarten (Dutch part)Slovak RepublicSloveniaSmall statesSolomon IslandsSouth AfricaSouth AsiaSouth Asia (IDA & IBRD)South SudanSpainSri LankaSt. Kitts and NevisSt. LuciaSt. Vincent and the GrenadinesSub-Saharan Africa Sub-Saharan Africa (excluding high income)Sub-Saharan Africa (IDA & IBRD countries)SudanSurinameSwazilandSwedenSwitzerlandSyrian Arab RepublicTajikistanTanzaniaThailandTimor-LesteTogoTongaTrinidad and TobagoTunisiaTurkeyTuvaluUgandaUkraineUnited KingdomUnited StatesUpper middle incomeUruguayVanuatuVenezuela, RBWest Bank and GazaWorldYemen, Rep.ZambiaZimbabwe Timeline:
This timeline shows a graph from 1977 to 2016 of Mauritius. No data until 1976. Number of actual observations by date: 40.
Source name:
World Development Indicators
Source organization:
International Monetary Fund, Balance of Payments Statistics Yearbook and data files.
Categories, topics:
Economy & Growth, Trade
Last updated:
apr 23, 2017
Indicators value changes by year
Maximum:
60.149
jan 1, 2007
At the date of observation
Value
Absolute change
Change from previous value
jan 1, 1977
44.988
+44.988
0.0%
jan 1, 1978
34.258
-10.73
-23.85%
jan 1, 1979
31.68
-2.577
-7.52%
jan 1, 1980
31.669
-0.012
-0.04%
jan 1, 1981
30.233
-1.436
-4.53%
jan 1, 1982
28.08
-2.152
-7.12%
jan 1, 1983
29.412
+1.331
4.74%
jan 1, 1984
31.301
+1.889
6.42%
jan 1, 1985
35.291
+3.99
12.75%
jan 1, 1986
45.139
+9.848
27.91%
jan 1, 1987
47.638
+2.499
5.54%
jan 1, 1988
48.612
+0.974
2.04%
jan 1, 1989
50.8
+2.188
4.5%
jan 1, 1990
49.191
-1.609
-3.17%
jan 1, 1991
50.473
+1.282
2.61%
jan 1, 1992
47.648
-2.825
-5.6%
jan 1, 1993
51.797
+4.149
8.71%
jan 1, 1994
53.658
+1.861
3.59%
jan 1, 1995
56.45
+2.793
5.2%
jan 1, 1996
55.262
-1.188
-2.1%
jan 1, 1997
52.476
-2.786
-5.04%
jan 1, 1998
53.502
+1.026
1.95%
jan 1, 1999
54.05
+0.548
1.02%
jan 1, 2000
52.402
-1.648
-3.05%
jan 1, 2001
50.647
-1.755
-3.35%
jan 1, 2002
50.973
+0.326
0.64%
jan 1, 2003
53.259
+2.286
4.48%
jan 1, 2004
54.431
+1.172
2.2%
jan 1, 2005
58.809
+4.378
8.04%
jan 1, 2006
53.831
-4.978
-8.46%
jan 1, 2007
60.149
+6.317
11.74%
jan 1, 2008
59.12
-1.028
-1.71%
jan 1, 2009
57.147
-1.973
-3.34%
jan 1, 2010
50.028
-7.12
-12.46%
jan 1, 2011
47.689
-2.339
-4.67%
jan 1, 2012
45.523
-2.166
-4.54%
jan 1, 2013
43.441
-2.082
-4.57%
jan 1, 2014
47.622
+4.181
9.62%
jan 1, 2015
45.35
-2.272
-4.77%
jan 1, 2016
50.387
+5.036
11.11%
Ranking of countries by current statistics by years


Comments: