29
/
en
AIzaSyAYiBZKx7MnpbEhh9jyipgxe19OcubqV5w
April 1, 2024
148703
Guyana
GUY
true
2
1
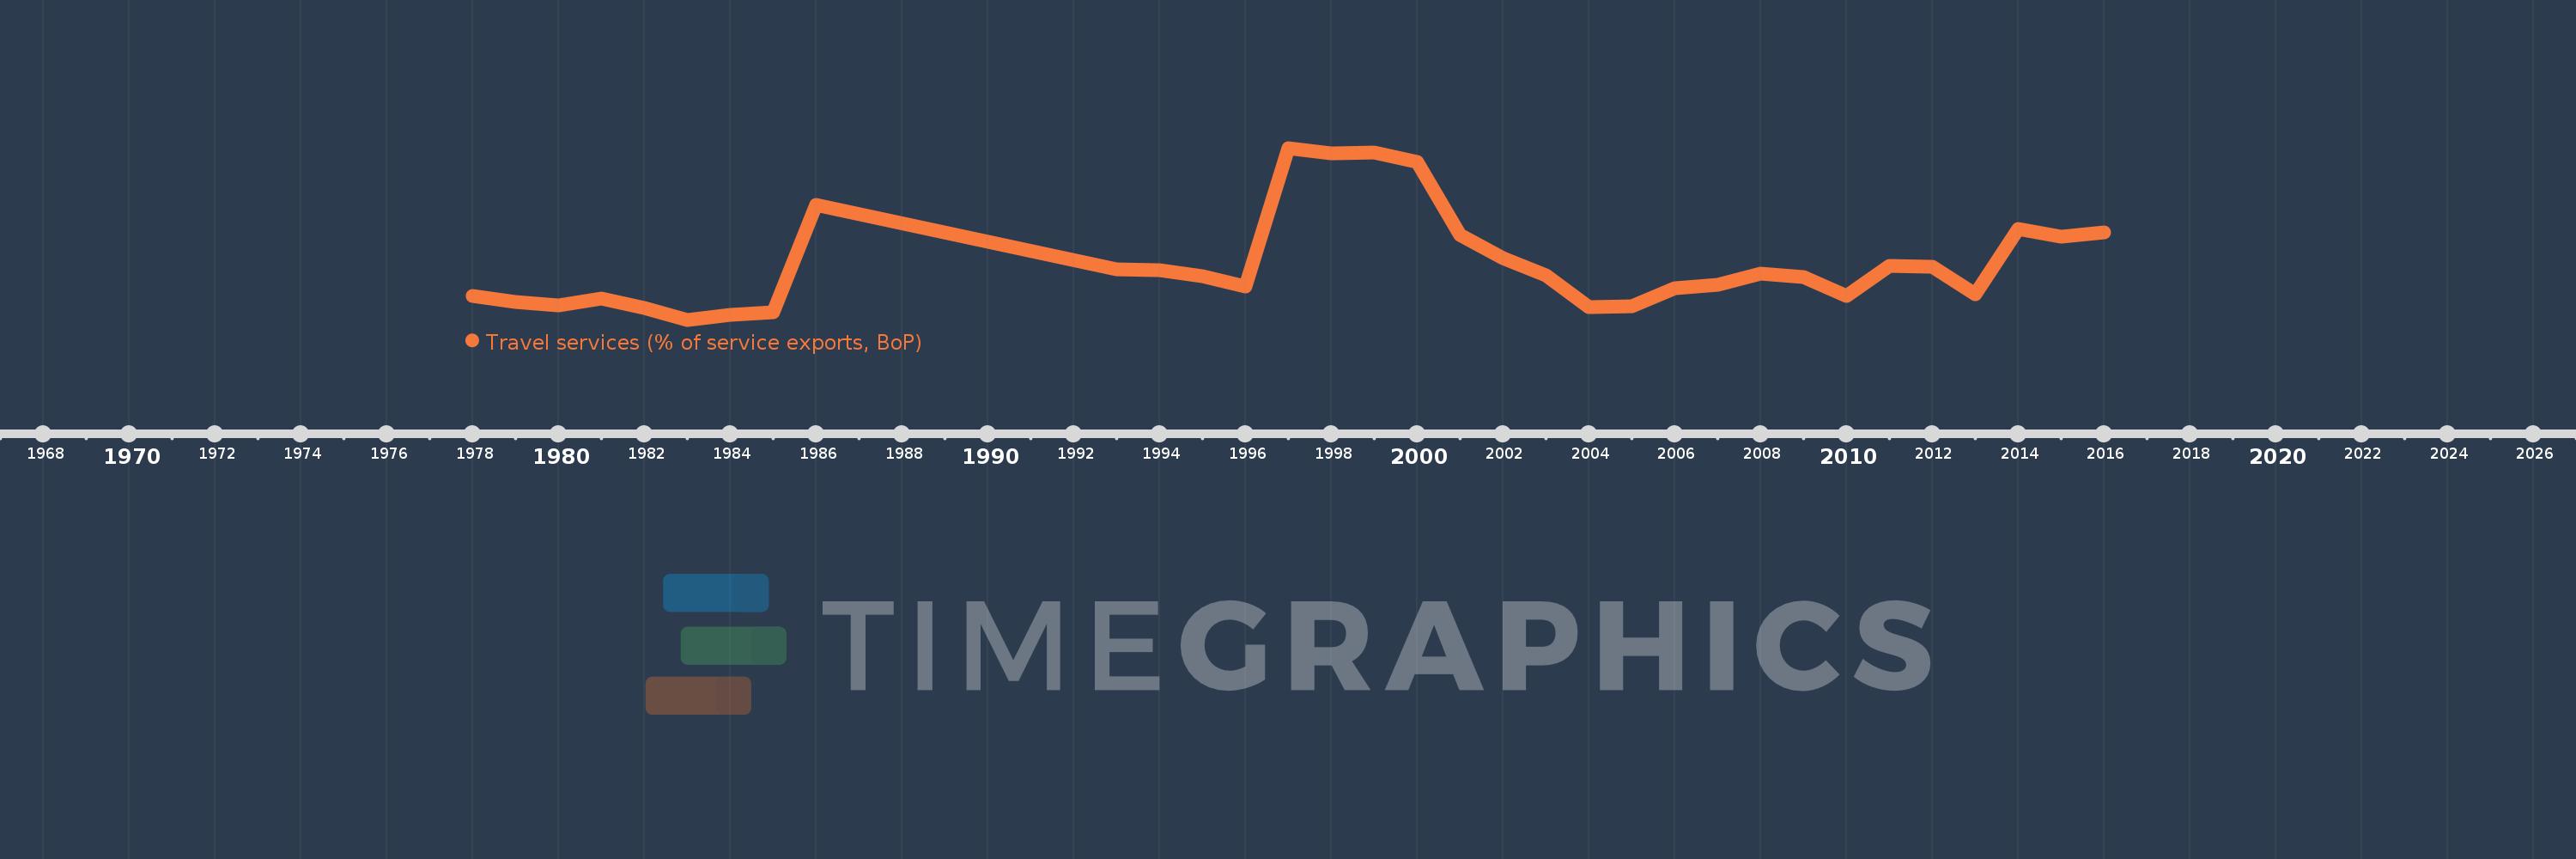
Travel services (% of service exports, BoP)
2016,2015,2014,2013,2012,2011,2010,2009,2008,2007,2006,2005,2004,2003,2002,2001,2000,1999,1998,1997,1996,1995,1994,1993,1986,1985,1984,1983,1982,1981,1980,1979,1978
This statistics in other country:
AfghanistanAlbaniaAlgeriaAngolaAntigua and BarbudaArab WorldArgentinaArmeniaArubaAustraliaAustriaAzerbaijanBahamas, TheBahrainBangladeshBarbadosBelarusBelgiumBelizeBeninBermudaBhutanBoliviaBosnia and HerzegovinaBotswanaBrazilBrunei DarussalamBulgariaBurkina FasoBurundiCabo VerdeCambodiaCameroonCanadaCaribbean small statesCentral African RepublicCentral Europe and the BalticsChadChileChinaColombiaComorosCongo, Dem. Rep.Congo, Rep.Costa RicaCote d'IvoireCroatiaCuracaoCyprusCzech RepublicDenmarkDjiboutiDominicaDominican RepublicEarly-demographic dividendEast Asia & PacificEast Asia & Pacific (excluding high income)East Asia & Pacific (IDA & IBRD countries)EcuadorEgypt, Arab Rep.El SalvadorEritreaEstoniaEthiopiaEuro areaEurope & Central AsiaEurope & Central Asia (excluding high income)Europe & Central Asia (IDA & IBRD countries)European UnionFaroe IslandsFijiFinlandFragile and conflict affected situationsFranceFrench PolynesiaGabonGambia, TheGeorgiaGermanyGhanaGreeceGrenadaGuatemalaGuineaGuinea-BissauGuyanaHaitiHeavily indebted poor countries (HIPC)High incomeHondurasHong Kong SAR, ChinaHungaryIBRD onlyIcelandIDA & IBRD totalIDA onlyIDA totalIndiaIndonesiaIran, Islamic Rep.IraqIrelandIsraelItalyJamaicaJapanJordanKazakhstanKenyaKiribatiKorea, Rep.KosovoKuwaitKyrgyz RepublicLao PDRLate-demographic dividendLatin America & Caribbean Latin America & Caribbean (excluding high income)Latin America & the Caribbean (IDA & IBRD countries)LatviaLeast developed countries: UN classificationLebanonLesothoLiberiaLibyaLithuaniaLow & middle incomeLow incomeLower middle incomeLuxembourgMacao SAR, ChinaMacedonia, FYRMadagascarMalawiMalaysiaMaldivesMaliMaltaMarshall IslandsMauritaniaMauritiusMexicoMicronesia, Fed. Sts.Middle East & North Africa (excluding high income)Middle East & North Africa (IDA & IBRD countries)Middle incomeMoldovaMongoliaMontenegroMoroccoMozambiqueMyanmarNamibiaNepalNetherlandsNew CaledoniaNew ZealandNicaraguaNigerNigeriaNorth AmericaNorwayOECD membersOmanOther small statesPacific island small statesPakistanPalauPanamaPapua New GuineaParaguayPeruPhilippinesPolandPortugalPost-demographic dividendPre-demographic dividendQatarRomaniaRussian FederationRwandaSamoaSao Tome and PrincipeSaudi ArabiaSenegalSerbiaSeychellesSierra LeoneSingaporeSint Maarten (Dutch part)Slovak RepublicSloveniaSmall statesSolomon IslandsSouth AfricaSouth AsiaSouth Asia (IDA & IBRD)South SudanSpainSri LankaSt. Kitts and NevisSt. LuciaSt. Vincent and the GrenadinesSub-Saharan Africa Sub-Saharan Africa (excluding high income)Sub-Saharan Africa (IDA & IBRD countries)SudanSurinameSwazilandSwedenSwitzerlandSyrian Arab RepublicTajikistanTanzaniaThailandTimor-LesteTogoTongaTrinidad and TobagoTunisiaTurkeyTuvaluUgandaUkraineUnited KingdomUnited StatesUpper middle incomeUruguayVanuatuVenezuela, RBWest Bank and GazaWorldYemen, Rep.ZambiaZimbabwe Timeline:
This timeline shows a graph from 1978 to 2016 of Guyana. No data until 1977. Number of actual observations by date: 33.
Source name:
World Development Indicators
Source organization:
International Monetary Fund, Balance of Payments Statistics Yearbook and data files.
Categories, topics:
Economy & Growth, Trade
Last updated:
apr 23, 2017
Indicators value changes by year
Minimum:
11.504
jan 1, 1983
Maximum:
77.802
jan 1, 1997
At the date of observation
Value
Absolute change
Change from previous value
jan 1, 1978
20.631
+20.631
0.0%
jan 1, 1979
18.359
-2.273
-11.02%
jan 1, 1980
17.125
-1.234
-6.72%
jan 1, 1981
19.841
+2.717
15.86%
jan 1, 1982
16.099
-3.742
-18.86%
jan 1, 1983
11.504
-4.595
-28.54%
jan 1, 1984
13.319
+1.815
15.77%
jan 1, 1985
14.286
+0.966
7.26%
jan 1, 1986
55.806
+41.52
290.64%
jan 1, 1993
30.977
-24.829
-44.49%
jan 1, 1994
30.748
-0.229
-0.74%
jan 1, 1995
28.174
-2.574
-8.37%
jan 1, 1996
24.417
-3.757
-13.34%
jan 1, 1997
77.802
+53.385
218.64%
jan 1, 1998
75.625
-2.177
-2.8%
jan 1, 1999
76.164
+0.539
0.71%
jan 1, 2000
72.245
-3.919
-5.15%
jan 1, 2001
44.359
-27.886
-38.6%
jan 1, 2002
35.174
-9.185
-20.71%
jan 1, 2003
28.613
-6.562
-18.65%
jan 1, 2004
16.454
-12.159
-42.49%
jan 1, 2005
16.852
+0.397
2.42%
jan 1, 2006
23.734
+6.883
40.84%
jan 1, 2007
25.119
+1.384
5.83%
jan 1, 2008
29.198
+4.08
16.24%
jan 1, 2009
27.92
-1.278
-4.38%
jan 1, 2010
20.551
-7.369
-26.39%
jan 1, 2011
32.435
+11.884
57.83%
jan 1, 2012
31.922
-0.513
-1.58%
jan 1, 2013
21.503
-10.42
-32.64%
jan 1, 2014
46.615
+25.112
116.79%
jan 1, 2015
43.534
-3.081
-6.61%
jan 1, 2016
45.204
+1.67
3.84%
Ranking of countries by current statistics by years


Comments: