29
/
en
AIzaSyAYiBZKx7MnpbEhh9jyipgxe19OcubqV5w
April 1, 2024
53133
OECD members
OED
false
2
1
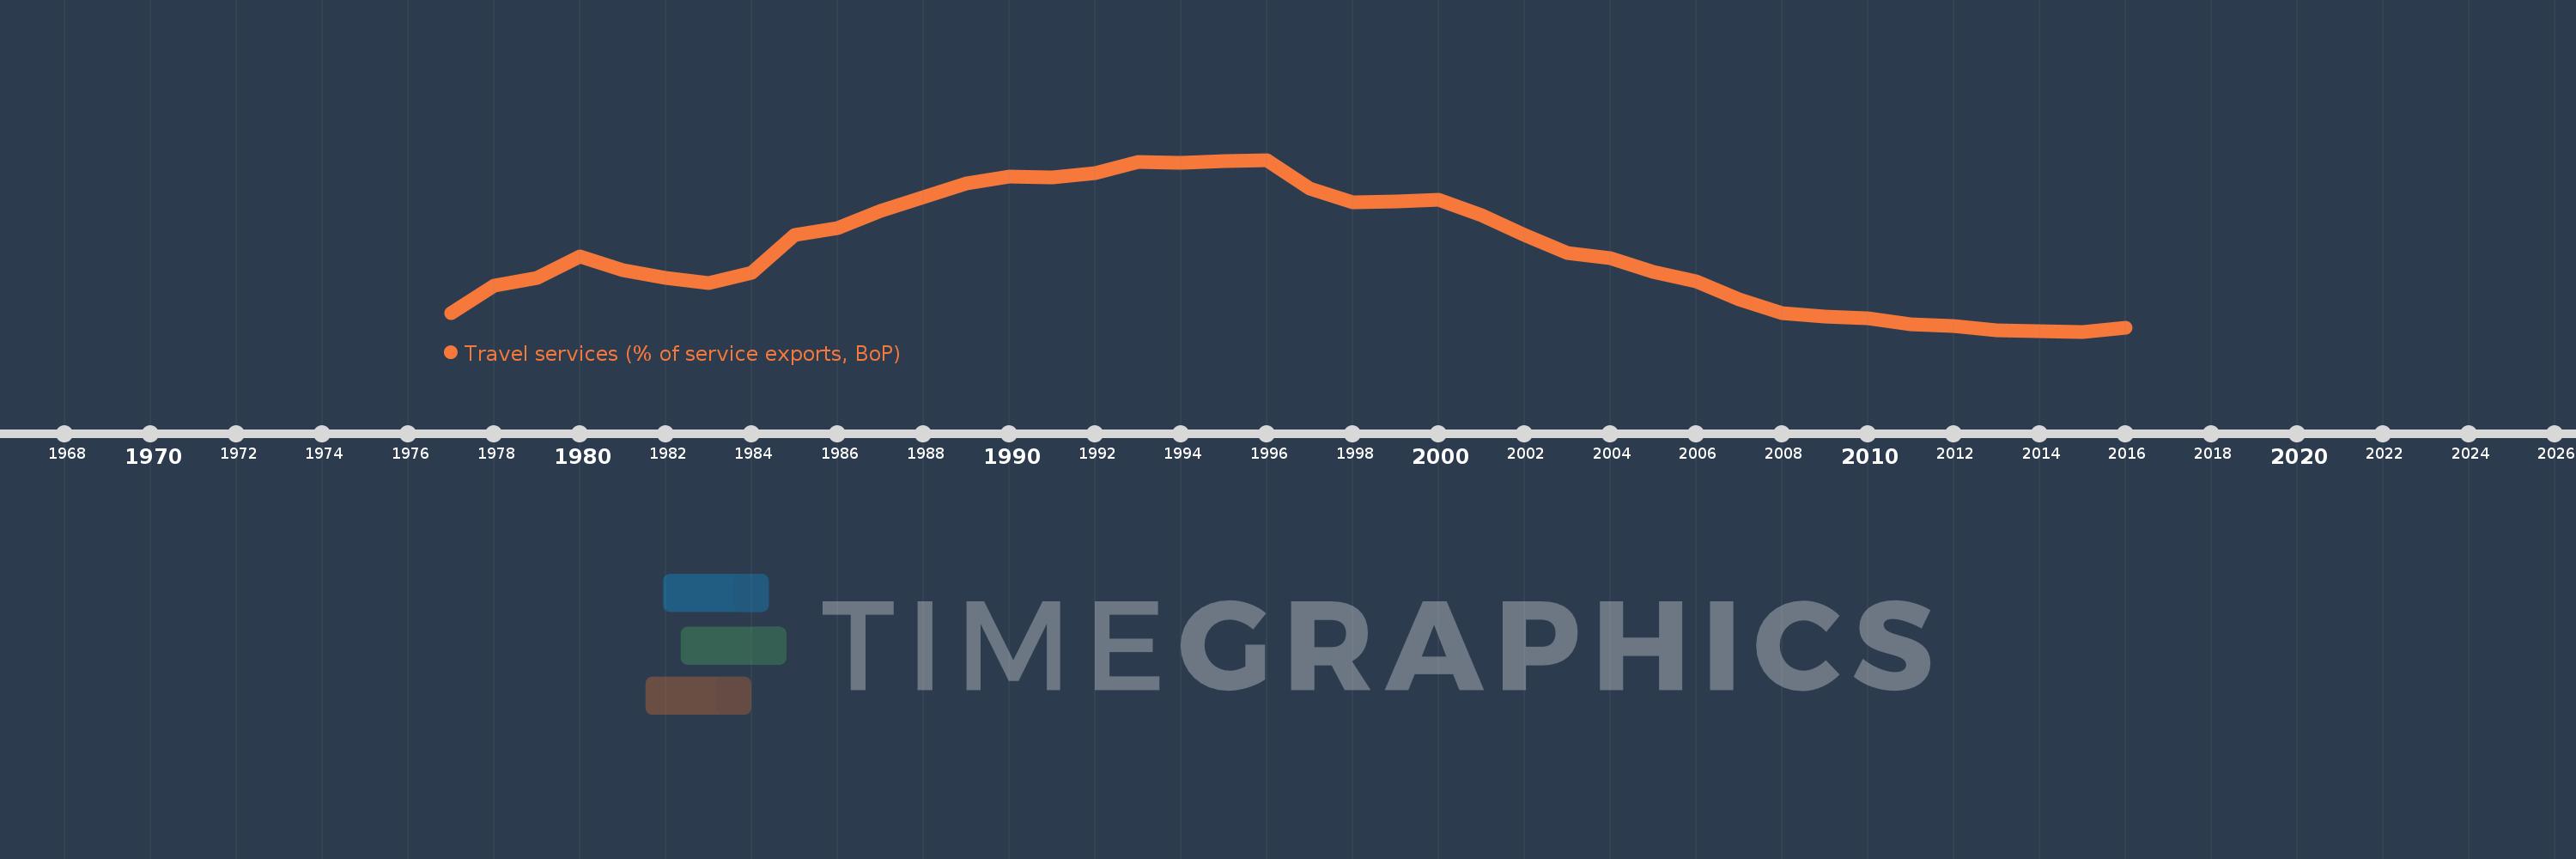
Travel services (% of service exports, BoP)
2016,2015,2014,2013,2012,2011,2010,2009,2008,2007,2006,2005,2004,2003,2002,2001,2000,1999,1998,1997,1996,1995,1994,1993,1992,1991,1990,1989,1988,1987,1986,1985,1984,1983,1982,1981,1980,1979,1978,1977
This statistics in other country:
AfghanistanAlbaniaAlgeriaAngolaAntigua and BarbudaArab WorldArgentinaArmeniaArubaAustraliaAustriaAzerbaijanBahamas, TheBahrainBangladeshBarbadosBelarusBelgiumBelizeBeninBermudaBhutanBoliviaBosnia and HerzegovinaBotswanaBrazilBrunei DarussalamBulgariaBurkina FasoBurundiCabo VerdeCambodiaCameroonCanadaCaribbean small statesCentral African RepublicCentral Europe and the BalticsChadChileChinaColombiaComorosCongo, Dem. Rep.Congo, Rep.Costa RicaCote d'IvoireCroatiaCuracaoCyprusCzech RepublicDenmarkDjiboutiDominicaDominican RepublicEarly-demographic dividendEast Asia & PacificEast Asia & Pacific (excluding high income)East Asia & Pacific (IDA & IBRD countries)EcuadorEgypt, Arab Rep.El SalvadorEritreaEstoniaEthiopiaEuro areaEurope & Central AsiaEurope & Central Asia (excluding high income)Europe & Central Asia (IDA & IBRD countries)European UnionFaroe IslandsFijiFinlandFragile and conflict affected situationsFranceFrench PolynesiaGabonGambia, TheGeorgiaGermanyGhanaGreeceGrenadaGuatemalaGuineaGuinea-BissauGuyanaHaitiHeavily indebted poor countries (HIPC)High incomeHondurasHong Kong SAR, ChinaHungaryIBRD onlyIcelandIDA & IBRD totalIDA onlyIDA totalIndiaIndonesiaIran, Islamic Rep.IraqIrelandIsraelItalyJamaicaJapanJordanKazakhstanKenyaKiribatiKorea, Rep.KosovoKuwaitKyrgyz RepublicLao PDRLate-demographic dividendLatin America & Caribbean Latin America & Caribbean (excluding high income)Latin America & the Caribbean (IDA & IBRD countries)LatviaLeast developed countries: UN classificationLebanonLesothoLiberiaLibyaLithuaniaLow & middle incomeLow incomeLower middle incomeLuxembourgMacao SAR, ChinaMacedonia, FYRMadagascarMalawiMalaysiaMaldivesMaliMaltaMarshall IslandsMauritaniaMauritiusMexicoMicronesia, Fed. Sts.Middle East & North Africa (excluding high income)Middle East & North Africa (IDA & IBRD countries)Middle incomeMoldovaMongoliaMontenegroMoroccoMozambiqueMyanmarNamibiaNepalNetherlandsNew CaledoniaNew ZealandNicaraguaNigerNigeriaNorth AmericaNorwayOECD membersOmanOther small statesPacific island small statesPakistanPalauPanamaPapua New GuineaParaguayPeruPhilippinesPolandPortugalPost-demographic dividendPre-demographic dividendQatarRomaniaRussian FederationRwandaSamoaSao Tome and PrincipeSaudi ArabiaSenegalSerbiaSeychellesSierra LeoneSingaporeSint Maarten (Dutch part)Slovak RepublicSloveniaSmall statesSolomon IslandsSouth AfricaSouth AsiaSouth Asia (IDA & IBRD)South SudanSpainSri LankaSt. Kitts and NevisSt. LuciaSt. Vincent and the GrenadinesSub-Saharan Africa Sub-Saharan Africa (excluding high income)Sub-Saharan Africa (IDA & IBRD countries)SudanSurinameSwazilandSwedenSwitzerlandSyrian Arab RepublicTajikistanTanzaniaThailandTimor-LesteTogoTongaTrinidad and TobagoTunisiaTurkeyTuvaluUgandaUkraineUnited KingdomUnited StatesUpper middle incomeUruguayVanuatuVenezuela, RBWest Bank and GazaWorldYemen, Rep.ZambiaZimbabwe Timeline:
This timeline shows a graph from 1977 to 2016 of OECD members. No data until 1976. Number of actual observations by date: 40.
Source name:
World Development Indicators
Source organization:
International Monetary Fund, Balance of Payments Statistics Yearbook and data files.
Categories, topics:
Economy & Growth, Trade
Last updated:
apr 23, 2017
Indicators value changes by year
Minimum:
21.374
jan 1, 2015
Maximum:
32.884
jan 1, 1996
At the date of observation
Value
Absolute change
Change from previous value
jan 1, 1977
22.614
+22.614
0.0%
jan 1, 1978
24.425
+1.811
8.01%
jan 1, 1979
24.989
+0.563
2.31%
jan 1, 1980
26.384
+1.395
5.58%
jan 1, 1981
25.489
-0.895
-3.39%
jan 1, 1982
24.981
-0.507
-1.99%
jan 1, 1983
24.651
-0.33
-1.32%
jan 1, 1984
25.294
+0.642
2.61%
jan 1, 1985
27.853
+2.559
10.12%
jan 1, 1986
28.301
+0.448
1.61%
jan 1, 1987
29.475
+1.174
4.15%
jan 1, 1988
30.366
+0.891
3.02%
jan 1, 1989
31.314
+0.947
3.12%
jan 1, 1990
31.746
+0.432
1.38%
jan 1, 1991
31.702
-0.044
-0.14%
jan 1, 1992
31.979
+0.277
0.87%
jan 1, 1993
32.768
+0.789
2.47%
jan 1, 1994
32.699
-0.069
-0.21%
jan 1, 1995
32.819
+0.12
0.37%
jan 1, 1996
32.884
+0.065
0.2%
jan 1, 1997
30.928
-1.956
-5.95%
jan 1, 1998
30.047
-0.881
-2.85%
jan 1, 1999
30.096
+0.049
0.16%
jan 1, 2000
30.229
+0.132
0.44%
jan 1, 2001
29.181
-1.048
-3.47%
jan 1, 2002
27.852
-1.328
-4.55%
jan 1, 2003
26.615
-1.237
-4.44%
jan 1, 2004
26.297
-0.318
-1.19%
jan 1, 2005
25.389
-0.908
-3.45%
jan 1, 2006
24.736
-0.653
-2.57%
jan 1, 2007
23.559
-1.178
-4.76%
jan 1, 2008
22.633
-0.925
-3.93%
jan 1, 2009
22.4
-0.233
-1.03%
jan 1, 2010
22.294
-0.106
-0.47%
jan 1, 2011
21.852
-0.442
-1.98%
jan 1, 2012
21.735
-0.116
-0.53%
jan 1, 2013
21.438
-0.297
-1.37%
jan 1, 2014
21.413
-0.025
-0.12%
jan 1, 2015
21.374
-0.039
-0.18%
jan 1, 2016
21.611
+0.236
1.11%
Ranking of countries by current statistics by years


Comments: