29
/
en
AIzaSyAYiBZKx7MnpbEhh9jyipgxe19OcubqV5w
April 1, 2024
252580
St. Vincent and the Grenadines
VCT
true
2
1
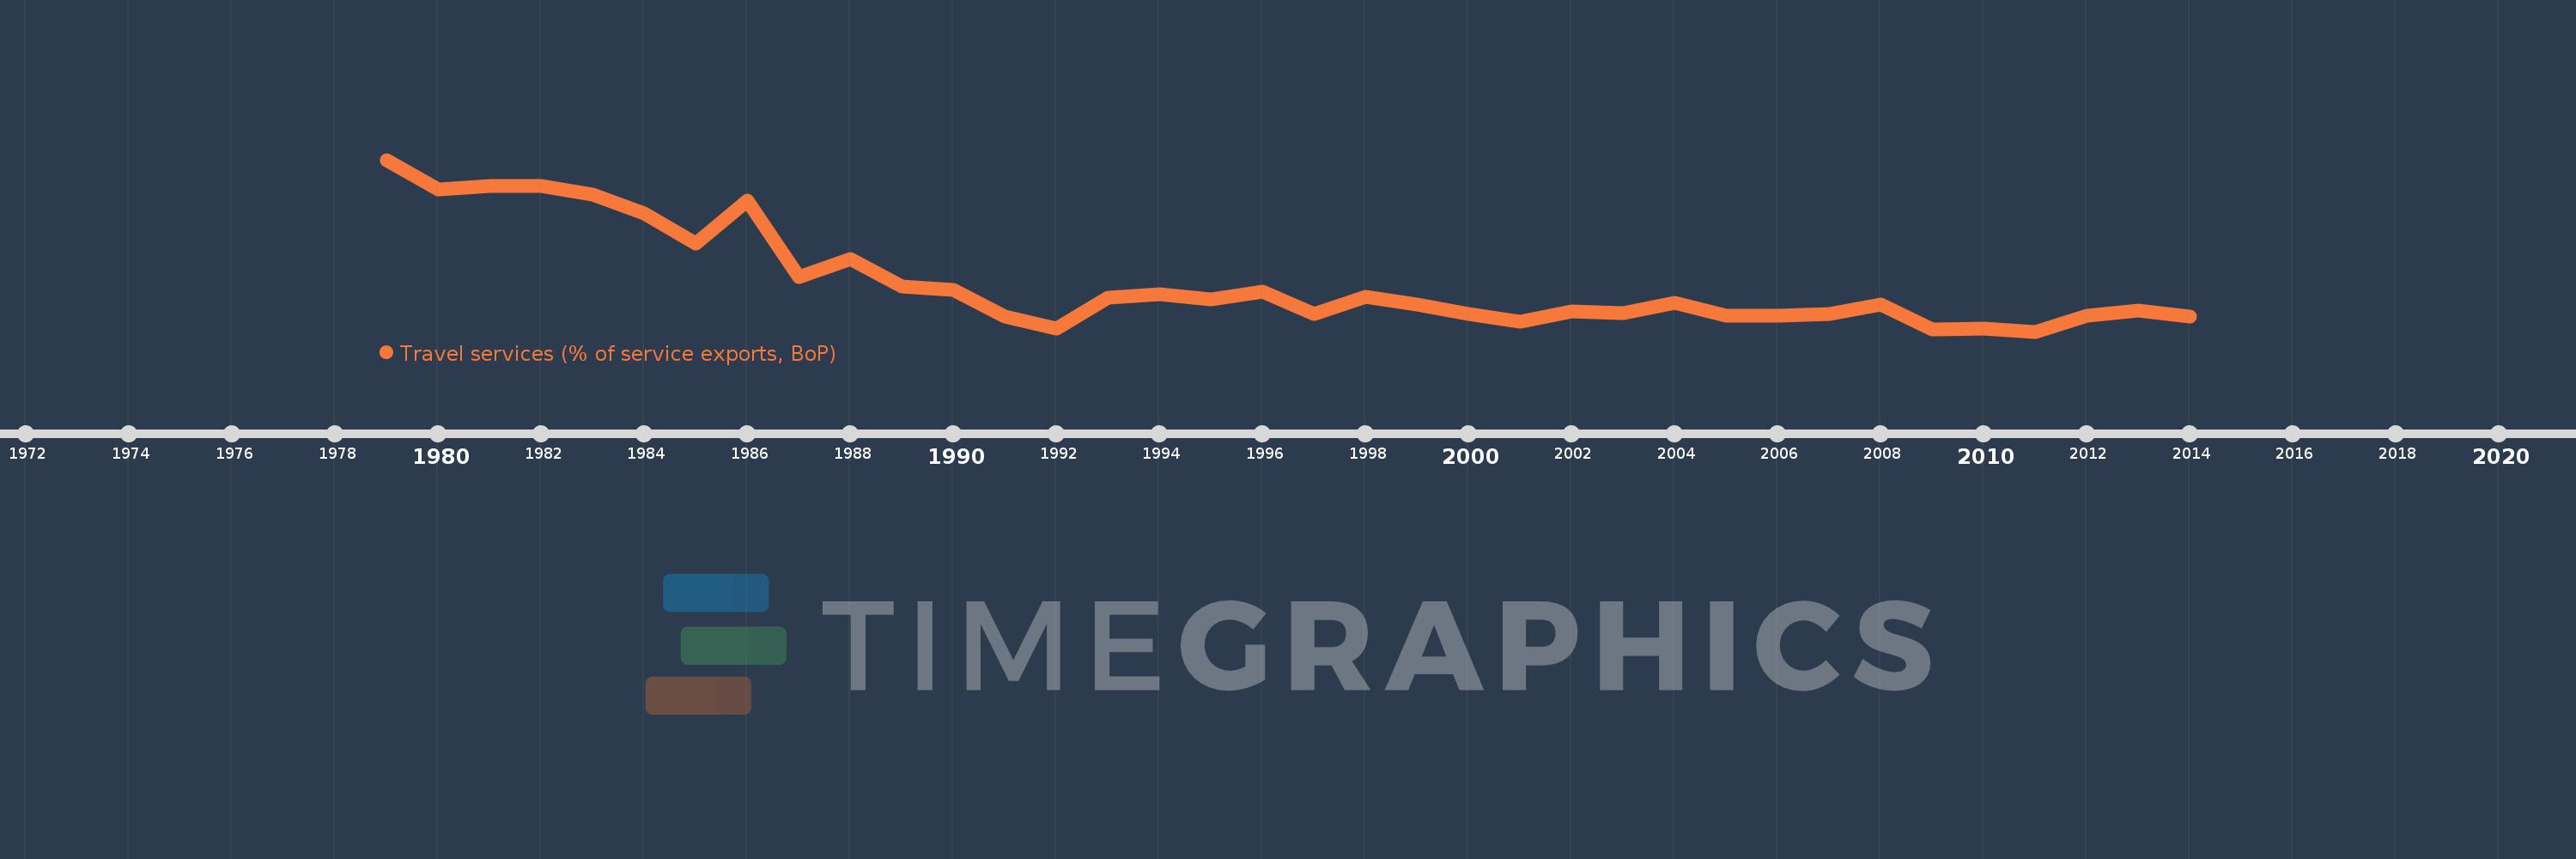
Travel services (% of service exports, BoP)
2014,2013,2012,2011,2010,2009,2008,2007,2006,2005,2004,2003,2002,2001,2000,1999,1998,1997,1996,1995,1994,1993,1992,1991,1990,1989,1988,1987,1986,1985,1984,1983,1982,1981,1980,1979
This statistics in other country:
AfghanistanAlbaniaAlgeriaAngolaAntigua and BarbudaArab WorldArgentinaArmeniaArubaAustraliaAustriaAzerbaijanBahamas, TheBahrainBangladeshBarbadosBelarusBelgiumBelizeBeninBermudaBhutanBoliviaBosnia and HerzegovinaBotswanaBrazilBrunei DarussalamBulgariaBurkina FasoBurundiCabo VerdeCambodiaCameroonCanadaCaribbean small statesCentral African RepublicCentral Europe and the BalticsChadChileChinaColombiaComorosCongo, Dem. Rep.Congo, Rep.Costa RicaCote d'IvoireCroatiaCuracaoCyprusCzech RepublicDenmarkDjiboutiDominicaDominican RepublicEarly-demographic dividendEast Asia & PacificEast Asia & Pacific (excluding high income)East Asia & Pacific (IDA & IBRD countries)EcuadorEgypt, Arab Rep.El SalvadorEritreaEstoniaEthiopiaEuro areaEurope & Central AsiaEurope & Central Asia (excluding high income)Europe & Central Asia (IDA & IBRD countries)European UnionFaroe IslandsFijiFinlandFragile and conflict affected situationsFranceFrench PolynesiaGabonGambia, TheGeorgiaGermanyGhanaGreeceGrenadaGuatemalaGuineaGuinea-BissauGuyanaHaitiHeavily indebted poor countries (HIPC)High incomeHondurasHong Kong SAR, ChinaHungaryIBRD onlyIcelandIDA & IBRD totalIDA onlyIDA totalIndiaIndonesiaIran, Islamic Rep.IraqIrelandIsraelItalyJamaicaJapanJordanKazakhstanKenyaKiribatiKorea, Rep.KosovoKuwaitKyrgyz RepublicLao PDRLate-demographic dividendLatin America & Caribbean Latin America & Caribbean (excluding high income)Latin America & the Caribbean (IDA & IBRD countries)LatviaLeast developed countries: UN classificationLebanonLesothoLiberiaLibyaLithuaniaLow & middle incomeLow incomeLower middle incomeLuxembourgMacao SAR, ChinaMacedonia, FYRMadagascarMalawiMalaysiaMaldivesMaliMaltaMarshall IslandsMauritaniaMauritiusMexicoMicronesia, Fed. Sts.Middle East & North Africa (excluding high income)Middle East & North Africa (IDA & IBRD countries)Middle incomeMoldovaMongoliaMontenegroMoroccoMozambiqueMyanmarNamibiaNepalNetherlandsNew CaledoniaNew ZealandNicaraguaNigerNigeriaNorth AmericaNorwayOECD membersOmanOther small statesPacific island small statesPakistanPalauPanamaPapua New GuineaParaguayPeruPhilippinesPolandPortugalPost-demographic dividendPre-demographic dividendQatarRomaniaRussian FederationRwandaSamoaSao Tome and PrincipeSaudi ArabiaSenegalSerbiaSeychellesSierra LeoneSingaporeSint Maarten (Dutch part)Slovak RepublicSloveniaSmall statesSolomon IslandsSouth AfricaSouth AsiaSouth Asia (IDA & IBRD)South SudanSpainSri LankaSt. Kitts and NevisSt. LuciaSt. Vincent and the GrenadinesSub-Saharan Africa Sub-Saharan Africa (excluding high income)Sub-Saharan Africa (IDA & IBRD countries)SudanSurinameSwazilandSwedenSwitzerlandSyrian Arab RepublicTajikistanTanzaniaThailandTimor-LesteTogoTongaTrinidad and TobagoTunisiaTurkeyTuvaluUgandaUkraineUnited KingdomUnited StatesUpper middle incomeUruguayVanuatuVenezuela, RBWest Bank and GazaWorldYemen, Rep.ZambiaZimbabwe Timeline:
This timeline shows a graph from 1979 to 2014 of St. Vincent and the Grenadines. No data until 1978. Number of actual observations by date: 36.
Source name:
World Development Indicators
Source organization:
International Monetary Fund, Balance of Payments Statistics Yearbook and data files.
Categories, topics:
Economy & Growth, Trade
Last updated:
apr 23, 2017
Indicators value changes by year
Minimum:
62.368
jan 1, 2011
At the date of observation
Value
Absolute change
Change from previous value
jan 1, 1979
100.0
+100.0
0.0%
jan 1, 1980
93.431
-6.569
-6.57%
jan 1, 1981
94.35
+0.92
0.98%
jan 1, 1982
94.18
-0.17
-0.18%
jan 1, 1983
92.357
-1.823
-1.94%
jan 1, 1984
88.202
-4.154
-4.5%
jan 1, 1985
81.675
-6.527
-7.4%
jan 1, 1986
91.146
+9.47
11.6%
jan 1, 1987
74.274
-16.872
-18.51%
jan 1, 1988
78.358
+4.084
5.5%
jan 1, 1989
72.304
-6.054
-7.73%
jan 1, 1990
71.587
-0.718
-0.99%
jan 1, 1991
65.619
-5.968
-8.34%
jan 1, 1992
62.955
-2.663
-4.06%
jan 1, 1993
69.718
+6.763
10.74%
jan 1, 1994
70.505
+0.787
1.13%
jan 1, 1995
69.422
-1.083
-1.54%
jan 1, 1996
71.116
+1.693
2.44%
jan 1, 1997
66.231
-4.884
-6.87%
jan 1, 1998
70.047
+3.816
5.76%
jan 1, 1999
68.34
-1.707
-2.44%
jan 1, 2000
66.291
-2.049
-3.0%
jan 1, 2001
64.45
-1.841
-2.78%
jan 1, 2002
66.822
+2.372
3.68%
jan 1, 2003
66.387
-0.435
-0.65%
jan 1, 2004
68.69
+2.304
3.47%
jan 1, 2005
65.799
-2.891
-4.21%
jan 1, 2006
65.764
-0.034
-0.05%
jan 1, 2007
66.297
+0.533
0.81%
jan 1, 2008
68.384
+2.087
3.15%
jan 1, 2009
62.772
-5.612
-8.21%
jan 1, 2010
62.996
+0.224
0.36%
jan 1, 2011
62.368
-0.628
-1.0%
jan 1, 2012
65.784
+3.416
5.48%
jan 1, 2013
67.015
+1.23
1.87%
jan 1, 2014
65.646
-1.368
-2.04%
Ranking of countries by current statistics by years


Comments: