29
/
en
AIzaSyAYiBZKx7MnpbEhh9jyipgxe19OcubqV5w
April 1, 2024
248155
Spain
ESP
true
2
1
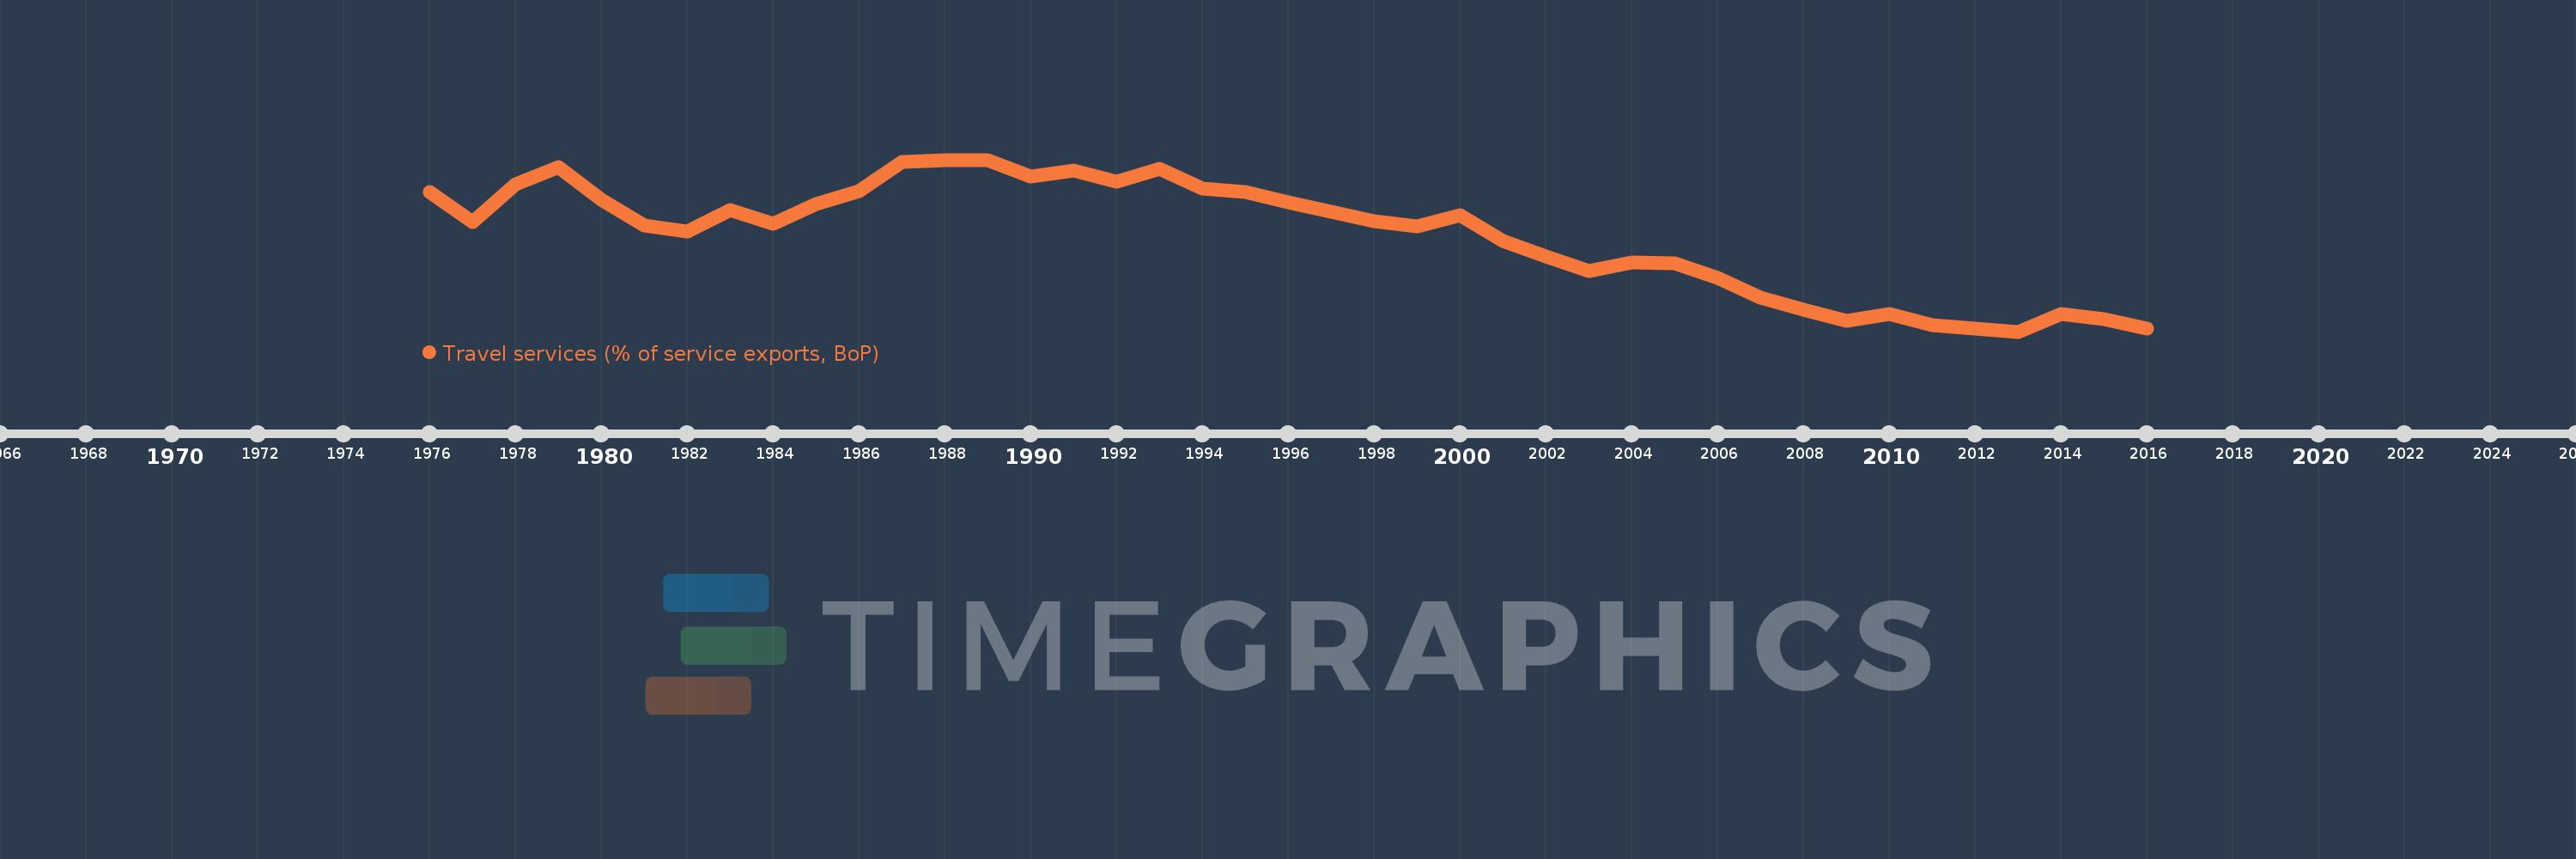
Travel services (% of service exports, BoP)
2016,2015,2014,2013,2012,2011,2010,2009,2008,2007,2006,2005,2004,2003,2002,2001,2000,1999,1998,1997,1996,1995,1994,1993,1992,1991,1990,1989,1988,1987,1986,1985,1984,1983,1982,1981,1980,1979,1978,1977,1976
This statistics in other country:
AfghanistanAlbaniaAlgeriaAngolaAntigua and BarbudaArab WorldArgentinaArmeniaArubaAustraliaAustriaAzerbaijanBahamas, TheBahrainBangladeshBarbadosBelarusBelgiumBelizeBeninBermudaBhutanBoliviaBosnia and HerzegovinaBotswanaBrazilBrunei DarussalamBulgariaBurkina FasoBurundiCabo VerdeCambodiaCameroonCanadaCaribbean small statesCentral African RepublicCentral Europe and the BalticsChadChileChinaColombiaComorosCongo, Dem. Rep.Congo, Rep.Costa RicaCote d'IvoireCroatiaCuracaoCyprusCzech RepublicDenmarkDjiboutiDominicaDominican RepublicEarly-demographic dividendEast Asia & PacificEast Asia & Pacific (excluding high income)East Asia & Pacific (IDA & IBRD countries)EcuadorEgypt, Arab Rep.El SalvadorEritreaEstoniaEthiopiaEuro areaEurope & Central AsiaEurope & Central Asia (excluding high income)Europe & Central Asia (IDA & IBRD countries)European UnionFaroe IslandsFijiFinlandFragile and conflict affected situationsFranceFrench PolynesiaGabonGambia, TheGeorgiaGermanyGhanaGreeceGrenadaGuatemalaGuineaGuinea-BissauGuyanaHaitiHeavily indebted poor countries (HIPC)High incomeHondurasHong Kong SAR, ChinaHungaryIBRD onlyIcelandIDA & IBRD totalIDA onlyIDA totalIndiaIndonesiaIran, Islamic Rep.IraqIrelandIsraelItalyJamaicaJapanJordanKazakhstanKenyaKiribatiKorea, Rep.KosovoKuwaitKyrgyz RepublicLao PDRLate-demographic dividendLatin America & Caribbean Latin America & Caribbean (excluding high income)Latin America & the Caribbean (IDA & IBRD countries)LatviaLeast developed countries: UN classificationLebanonLesothoLiberiaLibyaLithuaniaLow & middle incomeLow incomeLower middle incomeLuxembourgMacao SAR, ChinaMacedonia, FYRMadagascarMalawiMalaysiaMaldivesMaliMaltaMarshall IslandsMauritaniaMauritiusMexicoMicronesia, Fed. Sts.Middle East & North Africa (excluding high income)Middle East & North Africa (IDA & IBRD countries)Middle incomeMoldovaMongoliaMontenegroMoroccoMozambiqueMyanmarNamibiaNepalNetherlandsNew CaledoniaNew ZealandNicaraguaNigerNigeriaNorth AmericaNorwayOECD membersOmanOther small statesPacific island small statesPakistanPalauPanamaPapua New GuineaParaguayPeruPhilippinesPolandPortugalPost-demographic dividendPre-demographic dividendQatarRomaniaRussian FederationRwandaSamoaSao Tome and PrincipeSaudi ArabiaSenegalSerbiaSeychellesSierra LeoneSingaporeSint Maarten (Dutch part)Slovak RepublicSloveniaSmall statesSolomon IslandsSouth AfricaSouth AsiaSouth Asia (IDA & IBRD)South SudanSpainSri LankaSt. Kitts and NevisSt. LuciaSt. Vincent and the GrenadinesSub-Saharan Africa Sub-Saharan Africa (excluding high income)Sub-Saharan Africa (IDA & IBRD countries)SudanSurinameSwazilandSwedenSwitzerlandSyrian Arab RepublicTajikistanTanzaniaThailandTimor-LesteTogoTongaTrinidad and TobagoTunisiaTurkeyTuvaluUgandaUkraineUnited KingdomUnited StatesUpper middle incomeUruguayVanuatuVenezuela, RBWest Bank and GazaWorldYemen, Rep.ZambiaZimbabwe Timeline:
This timeline shows a graph from 1976 to 2016 of Spain. No data until 1975. Number of actual observations by date: 41.
Source name:
World Development Indicators
Source organization:
International Monetary Fund, Balance of Payments Statistics Yearbook and data files.
Categories, topics:
Economy & Growth, Trade
Last updated:
apr 23, 2017
Indicators value changes by year
Minimum:
47.355
jan 1, 2013
Maximum:
67.804
jan 1, 1988
At the date of observation
Value
Absolute change
Change from previous value
jan 1, 1976
63.949
+63.949
0.0%
jan 1, 1977
60.367
-3.582
-5.6%
jan 1, 1978
64.913
+4.546
7.53%
jan 1, 1979
66.896
+1.984
3.06%
jan 1, 1980
63.01
-3.886
-5.81%
jan 1, 1981
60.014
-2.996
-4.76%
jan 1, 1982
59.288
-0.726
-1.21%
jan 1, 1983
61.786
+2.498
4.21%
jan 1, 1984
60.155
-1.631
-2.64%
jan 1, 1985
62.546
+2.391
3.97%
jan 1, 1986
64.044
+1.498
2.4%
jan 1, 1987
67.569
+3.525
5.5%
jan 1, 1988
67.804
+0.235
0.35%
jan 1, 1989
67.751
-0.053
-0.08%
jan 1, 1990
65.807
-1.944
-2.87%
jan 1, 1991
66.511
+0.704
1.07%
jan 1, 1992
65.168
-1.342
-2.02%
jan 1, 1993
66.776
+1.608
2.47%
jan 1, 1994
64.335
-2.442
-3.66%
jan 1, 1995
64.017
-0.317
-0.49%
jan 1, 1996
62.761
-1.256
-1.96%
jan 1, 1997
61.629
-1.132
-1.8%
jan 1, 1998
60.46
-1.169
-1.9%
jan 1, 1999
59.908
-0.551
-0.91%
jan 1, 2000
61.193
+1.285
2.14%
jan 1, 2001
58.155
-3.038
-4.96%
jan 1, 2002
56.316
-1.839
-3.16%
jan 1, 2003
54.582
-1.734
-3.08%
jan 1, 2004
55.541
+0.959
1.76%
jan 1, 2005
55.479
-0.062
-0.11%
jan 1, 2006
53.774
-1.705
-3.07%
jan 1, 2007
51.387
-2.387
-4.44%
jan 1, 2008
49.97
-1.417
-2.76%
jan 1, 2009
48.671
-1.299
-2.6%
jan 1, 2010
49.455
+0.785
1.61%
jan 1, 2011
48.101
-1.354
-2.74%
jan 1, 2012
47.702
-0.399
-0.83%
jan 1, 2013
47.355
-0.346
-0.73%
jan 1, 2014
49.485
+2.13
4.5%
jan 1, 2015
48.874
-0.611
-1.24%
jan 1, 2016
47.709
-1.165
-2.38%
Ranking of countries by current statistics by years


Comments: